
|
Clear Secure ، Inc. (أنت) تقييم DCF |
Fully Editable: Tailor To Your Needs In Excel Or Sheets
Professional Design: Trusted, Industry-Standard Templates
Investor-Approved Valuation Models
MAC/PC Compatible, Fully Unlocked
No Expertise Is Needed; Easy To Follow
Clear Secure, Inc. (YOU) Bundle
عزز استراتيجية الاستثمار الخاصة بك مع حاسبة (أنت) DCF! استكشف البيانات المالية الحقيقية لـ Clear Secure ، Inc. ، وضبط توقعات النمو والنفقات ، ومراقبة على الفور كيف تؤثر التقلبات على القيمة الجوهرية لـ (أنت).
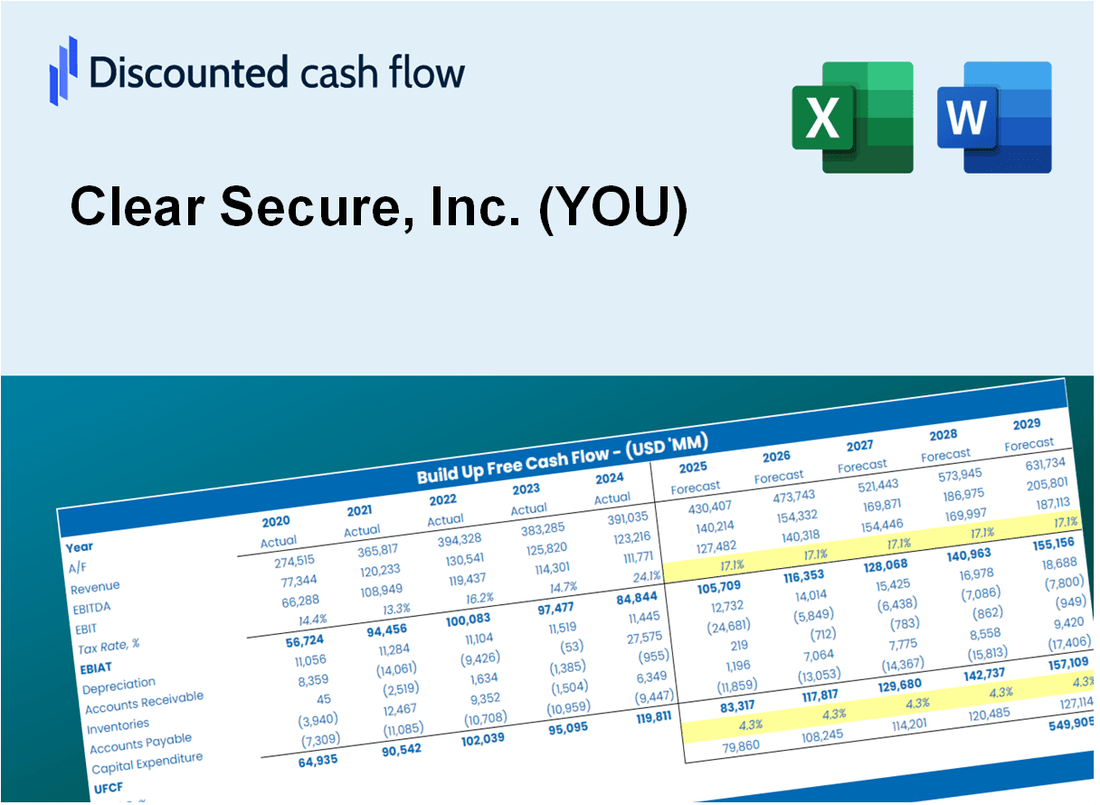
Discounted Cash Flow (DCF) - (USD MM)
| Year | AY1 2020 |
AY2 2021 |
AY3 2022 |
AY4 2023 |
AY5 2024 |
FY1 2025 |
FY2 2026 |
FY3 2027 |
FY4 2028 |
FY5 2029 |
|---|---|---|---|---|---|---|---|---|---|---|
| Revenue | 230.8 | 254.0 | 437.4 | 613.6 | 770.5 | 1,055.8 | 1,446.8 | 1,982.5 | 2,716.7 | 3,722.7 |
| Revenue Growth, % | 0 | 10.03 | 72.25 | 40.27 | 25.57 | 37.03 | 37.03 | 37.03 | 37.03 | 37.03 |
| EBITDA | -9.5 | -102.6 | -94.9 | 41.8 | 149.7 | -84.4 | -115.7 | -158.5 | -217.2 | -297.6 |
| EBITDA, % | -4.12 | -40.39 | -21.7 | 6.81 | 19.43 | -8 | -8 | -8 | -8 | -8 |
| Depreciation | 9.4 | 12.4 | 22.6 | 21.6 | 26.5 | 44.5 | 61.0 | 83.6 | 114.5 | 156.9 |
| Depreciation, % | 4.08 | 4.87 | 5.16 | 3.53 | 3.44 | 4.21 | 4.21 | 4.21 | 4.21 | 4.21 |
| EBIT | -18.9 | -114.9 | -117.5 | 20.1 | 123.2 | -128.9 | -176.6 | -242.1 | -331.7 | -454.5 |
| EBIT, % | -8.2 | -45.26 | -26.86 | 3.28 | 15.99 | -12.21 | -12.21 | -12.21 | -12.21 | -12.21 |
| Total Cash | 154.0 | 615.3 | 704.7 | 723.1 | 609.5 | 941.5 | 1,290.1 | 1,767.8 | 2,422.5 | 3,319.5 |
| Total Cash, percent | .0 | .0 | .0 | .0 | .0 | .0 | .0 | .0 | .0 | .0 |
| Account Receivables | .9 | 5.3 | 1.2 | .5 | .5 | 6.2 | 8.4 | 11.6 | 15.8 | 21.7 |
| Account Receivables, % | 0.39515 | 2.1 | 0.26724 | 0.08572653 | 0.0663216 | 0.58273 | 0.58273 | 0.58273 | 0.58273 | 0.58273 |
| Inventories | 13.0 | 19.5 | 30.6 | .0 | .0 | 42.9 | 58.8 | 80.5 | 110.3 | 151.2 |
| Inventories, % | 5.64 | 7.68 | 6.99 | 0 | 0 | 4.06 | 4.06 | 4.06 | 4.06 | 4.06 |
| Accounts Payable | 8.5 | 8.8 | 8.0 | 11.8 | 18.0 | 27.9 | 38.3 | 52.5 | 71.9 | 98.5 |
| Accounts Payable, % | 3.69 | 3.47 | 1.82 | 1.92 | 2.34 | 2.65 | 2.65 | 2.65 | 2.65 | 2.65 |
| Capital Expenditure | -16.9 | -29.0 | -31.9 | -25.6 | -12.0 | -67.1 | -91.9 | -125.9 | -172.6 | -236.5 |
| Capital Expenditure, % | -7.33 | -11.41 | -7.29 | -4.16 | -1.56 | -6.35 | -6.35 | -6.35 | -6.35 | -6.35 |
| Tax Rate, % | -154.67 | -154.67 | -154.67 | -154.67 | -154.67 | -154.67 | -154.67 | -154.67 | -154.67 | -154.67 |
| EBITAT | -19.0 | -115.2 | -115.4 | 11.2 | 313.7 | -117.0 | -160.3 | -219.7 | -301.0 | -412.5 |
| Depreciation | ||||||||||
| Changes in Account Receivables | ||||||||||
| Changes in Inventories | ||||||||||
| Changes in Accounts Payable | ||||||||||
| Capital Expenditure | ||||||||||
| UFCF | -31.9 | -142.4 | -132.5 | 42.3 | 334.5 | -178.2 | -199.1 | -272.8 | -373.8 | -512.2 |
| WACC, % | 9.18 | 9.18 | 9.18 | 9.14 | 9.18 | 9.18 | 9.18 | 9.18 | 9.18 | 9.18 |
| PV UFCF | ||||||||||
| SUM PV UFCF | -1,133.1 | |||||||||
| Long Term Growth Rate, % | 2.00 | |||||||||
| Free cash flow (T + 1) | -522 | |||||||||
| Terminal Value | -7,281 | |||||||||
| Present Terminal Value | -4,694 | |||||||||
| Enterprise Value | -5,827 | |||||||||
| Net Debt | 54 | |||||||||
| Equity Value | -5,881 | |||||||||
| Diluted Shares Outstanding, MM | 145 | |||||||||
| Equity Value Per Share | -40.70 |
What You Will Get
- Real Clear Secure Data: Preloaded financials – from revenue to EBIT – based on actual and projected figures for Clear Secure, Inc. (YOU).
- Full Customization: Adjust all critical parameters (yellow cells) like WACC, growth %, and tax rates to fit your analysis.
- Instant Valuation Updates: Automatic recalculations to analyze the impact of changes on Clear Secure, Inc.'s (YOU) fair value.
- Versatile Excel Template: Tailored for quick edits, scenario testing, and detailed projections specific to Clear Secure, Inc. (YOU).
- Time-Saving and Accurate: Skip building models from scratch while ensuring precision and flexibility in your evaluations.
Key Features
- Accurate Financial Data: Gain access to reliable pre-loaded historical figures and future forecasts for Clear Secure, Inc. (YOU).
- Adjustable Forecast Parameters: Modify highlighted cells for key metrics such as WACC, growth rates, and profit margins.
- Real-Time Calculations: Automatic refresh of DCF, Net Present Value (NPV), and cash flow assessments.
- User-Friendly Dashboard: Intuitive charts and summaries to help you visualize your valuation outcomes.
- Designed for All Levels: A straightforward, easy-to-navigate format tailored for investors, CFOs, and consultants alike.
How It Works
- Step 1: Download the prebuilt Excel template featuring Clear Secure, Inc. ([YOU]) data.
- Step 2: Review the pre-filled sheets to familiarize yourself with essential metrics.
- Step 3: Modify forecasts and assumptions in the editable yellow cells (WACC, growth, margins).
- Step 4: Instantly see the recalculated results, including the intrinsic value of Clear Secure, Inc. ([YOU]).
- Step 5: Use the outputs to make informed investment decisions or create detailed reports.
Why Choose Clear Secure, Inc. (YOU) Calculator?
- All-in-One Solution: Combines DCF, WACC, and financial ratio analyses tailored for Clear Secure, Inc. (YOU).
- Flexible Inputs: Modify the yellow-highlighted cells to explore different financial scenarios.
- In-Depth Analysis: Automatically computes Clear Secure, Inc.'s (YOU) intrinsic value and Net Present Value.
- Preloaded Information: Access historical and projected data for reliable analysis.
- High-Quality Standards: Perfect for financial analysts, investors, and business consultants focusing on Clear Secure, Inc. (YOU).
Who Should Use Clear Secure, Inc. (YOU)?
- Investors: Evaluate Clear Secure’s market position prior to making investment decisions.
- CFOs and Financial Analysts: Enhance valuation methodologies and validate financial forecasts.
- Startup Founders: Understand the valuation strategies of leading companies like Clear Secure.
- Consultants: Provide comprehensive valuation analyses and reports to clients.
- Students and Educators: Utilize current data to learn and teach valuation principles effectively.
What the Template Contains
- Pre-Filled Data: Includes Clear Secure, Inc.'s (YOU) historical financials and forecasts.
- Discounted Cash Flow Model: Editable DCF valuation model with automatic calculations.
- Weighted Average Cost of Capital (WACC): A dedicated sheet for calculating WACC based on custom inputs.
- Key Financial Ratios: Analyze Clear Secure, Inc.'s (YOU) profitability, efficiency, and leverage.
- Customizable Inputs: Edit revenue growth, margins, and tax rates with ease.
- Clear Dashboard: Charts and tables summarizing key valuation results.
Disclaimer
All information, articles, and product details provided on this website are for general informational and educational purposes only. We do not claim any ownership over, nor do we intend to infringe upon, any trademarks, copyrights, logos, brand names, or other intellectual property mentioned or depicted on this site. Such intellectual property remains the property of its respective owners, and any references here are made solely for identification or informational purposes, without implying any affiliation, endorsement, or partnership.
We make no representations or warranties, express or implied, regarding the accuracy, completeness, or suitability of any content or products presented. Nothing on this website should be construed as legal, tax, investment, financial, medical, or other professional advice. In addition, no part of this site—including articles or product references—constitutes a solicitation, recommendation, endorsement, advertisement, or offer to buy or sell any securities, franchises, or other financial instruments, particularly in jurisdictions where such activity would be unlawful.
All content is of a general nature and may not address the specific circumstances of any individual or entity. It is not a substitute for professional advice or services. Any actions you take based on the information provided here are strictly at your own risk. You accept full responsibility for any decisions or outcomes arising from your use of this website and agree to release us from any liability in connection with your use of, or reliance upon, the content or products found herein.