
|
17 التعليم & Technology Group Inc. (YQ) DCF تقييم |
Fully Editable: Tailor To Your Needs In Excel Or Sheets
Professional Design: Trusted, Industry-Standard Templates
Investor-Approved Valuation Models
MAC/PC Compatible, Fully Unlocked
No Expertise Is Needed; Easy To Follow
17 Education & Technology Group Inc. (YQ) Bundle
قم بتعزيز استراتيجيات الاستثمار الخاصة بك باستخدام حاسبة DCF (YQ)! استكشف التعليم الأصيل 17 & البيانات المالية لمجموعة التكنولوجيا، وتعديل تنبؤات النمو والنفقات، ومراقبة فورية كيف تؤثر هذه التغييرات على القيمة الجوهرية لـ (YQ).
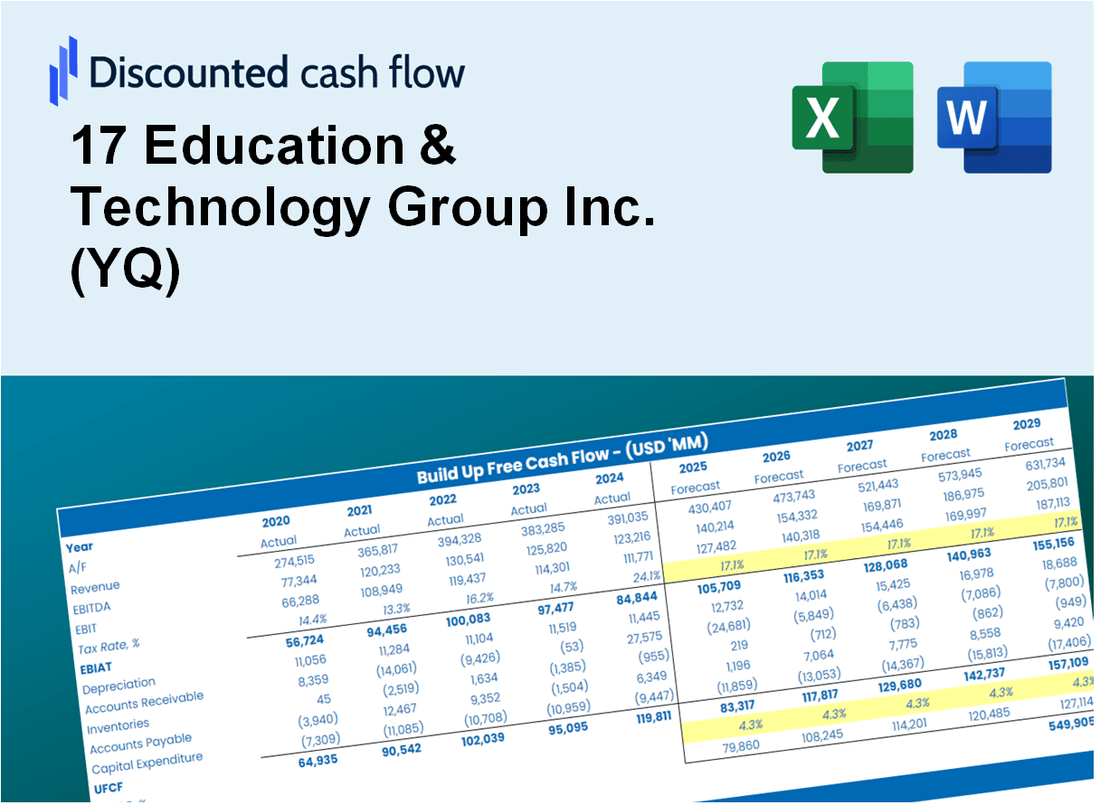
Discounted Cash Flow (DCF) - (USD MM)
| Year | AY1 2020 |
AY2 2021 |
AY3 2022 |
AY4 2023 |
AY5 2024 |
FY1 2025 |
FY2 2026 |
FY3 2027 |
FY4 2028 |
FY5 2029 |
|---|---|---|---|---|---|---|---|---|---|---|
| Revenue | 182.0 | 307.1 | 74.7 | 24.0 | 26.6 | 22.3 | 18.8 | 15.8 | 13.2 | 11.1 |
| Revenue Growth, % | 0 | 68.77 | -75.69 | -67.81 | 10.67 | -16.01 | -16.01 | -16.01 | -16.01 | -16.01 |
| EBITDA | -182.0 | -181.0 | -26.2 | -45.9 | -28.3 | -17.6 | -14.8 | -12.4 | -10.4 | -8.8 |
| EBITDA, % | -100 | -58.93 | -35.1 | -191.02 | -106.51 | -78.81 | -78.81 | -78.81 | -78.81 | -78.81 |
| Depreciation | 5.6 | 9.1 | 3.5 | 2.3 | 1.7 | 1.2 | 1.0 | .8 | .7 | .6 |
| Depreciation, % | 3.07 | 2.96 | 4.66 | 9.46 | 6.49 | 5.33 | 5.33 | 5.33 | 5.33 | 5.33 |
| EBIT | -187.5 | -190.1 | -29.7 | -48.2 | -30.1 | -17.9 | -15.1 | -12.7 | -10.6 | -8.9 |
| EBIT, % | -103.07 | -61.9 | -39.76 | -200.48 | -113 | -80.33 | -80.33 | -80.33 | -80.33 | -80.33 |
| Total Cash | 398.5 | 167.4 | 103.1 | 67.0 | 50.5 | 20.3 | 17.1 | 14.3 | 12.0 | 10.1 |
| Total Cash, percent | .0 | .0 | .0 | .0 | .0 | .0 | .0 | .0 | .0 | .0 |
| Account Receivables | 1.0 | 3.2 | 7.3 | 8.4 | 9.5 | 3.7 | 3.1 | 2.6 | 2.2 | 1.8 |
| Account Receivables, % | 0.57186 | 1.06 | 9.8 | 34.93 | 35.72 | 16.42 | 16.42 | 16.42 | 16.42 | 16.42 |
| Inventories | .0 | -3.2 | 1.4 | .0 | .0 | .0 | .0 | .0 | .0 | .0 |
| Inventories, % | 0 | -1.06 | 1.93 | 0 | 0 | 0.17381 | 0.17381 | 0.17381 | 0.17381 | 0.17381 |
| Accounts Payable | .0 | .0 | .0 | .0 | .0 | .0 | .0 | .0 | .0 | .0 |
| Accounts Payable, % | 0 | 0 | 0 | 0 | 0 | 0 | 0 | 0 | 0 | 0 |
| Capital Expenditure | -12.6 | -18.2 | -.4 | -3.7 | -1.3 | -1.5 | -1.3 | -1.1 | -.9 | -.8 |
| Capital Expenditure, % | -6.91 | -5.92 | -0.52028 | -15.55 | -4.95 | -6.77 | -6.77 | -6.77 | -6.77 | -6.77 |
| Tax Rate, % | 0 | 0 | 0 | 0 | 0 | 0 | 0 | 0 | 0 | 0 |
| EBITAT | -187.5 | -190.1 | -29.7 | -48.2 | -30.1 | -17.9 | -15.1 | -12.7 | -10.6 | -8.9 |
| Depreciation | ||||||||||
| Changes in Account Receivables | ||||||||||
| Changes in Inventories | ||||||||||
| Changes in Accounts Payable | ||||||||||
| Capital Expenditure | ||||||||||
| UFCF | -195.6 | -198.1 | -35.3 | -49.3 | -30.8 | -12.5 | -14.7 | -12.4 | -10.4 | -8.7 |
| WACC, % | 4.18 | 4.18 | 4.18 | 4.18 | 4.18 | 4.18 | 4.18 | 4.18 | 4.18 | 4.18 |
| PV UFCF | ||||||||||
| SUM PV UFCF | -52.5 | |||||||||
| Long Term Growth Rate, % | 2.00 | |||||||||
| Free cash flow (T + 1) | -9 | |||||||||
| Terminal Value | -408 | |||||||||
| Present Terminal Value | -333 | |||||||||
| Enterprise Value | -385 | |||||||||
| Net Debt | -31 | |||||||||
| Equity Value | -354 | |||||||||
| Diluted Shares Outstanding, MM | 0 | |||||||||
| Equity Value Per Share | -2,201.32 |
What You Will Get
- Real YQ Data: Preloaded financials – from revenue to EBIT – based on actual and projected figures.
- Full Customization: Adjust all critical parameters (yellow cells) like WACC, growth %, and tax rates.
- Instant Valuation Updates: Automatic recalculations to analyze the impact of changes on YQ’s fair value.
- Versatile Excel Template: Tailored for quick edits, scenario testing, and detailed projections.
- Time-Saving and Accurate: Skip building models from scratch while maintaining precision and flexibility.
Key Features
- Customizable Learning Metrics: Adjust essential parameters such as student engagement rates, course completion percentages, and revenue forecasts.
- Instant Educational Analytics: Provides real-time insights into performance metrics and growth projections.
- Industry-Leading Precision: Leverages 17 Education & Technology Group Inc.'s (YQ) actual data for accurate educational assessments.
- Effortless Scenario Simulation: Easily evaluate various educational strategies and their potential impacts.
- Efficiency Booster: Streamlines the process of developing comprehensive educational models.
How It Works
- 1. Access the Template: Download and open the Excel file containing 17 Education & Technology Group Inc.'s (YQ) preloaded data.
- 2. Adjust Assumptions: Modify key inputs such as enrollment growth rates, operating expenses, and capital investments.
- 3. Analyze Results Immediately: The DCF model automatically calculates intrinsic value and NPV based on your inputs.
- 4. Explore Scenarios: Evaluate various forecasts to assess different valuation possibilities.
- 5. Present with Assurance: Share professional valuation insights to back up your strategic decisions.
Why Choose This Calculator for 17 Education & Technology Group Inc. (YQ)?
- All-in-One Solution: Combines DCF, WACC, and financial ratio analyses tailored for 17 Education & Technology Group Inc. (YQ).
- Flexible Inputs: Modify yellow-highlighted cells to explore different scenarios specific to 17 Education & Technology Group Inc. (YQ).
- In-Depth Analysis: Automatically computes the intrinsic value and Net Present Value for 17 Education & Technology Group Inc. (YQ).
- Preloaded Information: Historical and projected data provide reliable starting points for analysis.
- Expert-Level Quality: Perfect for financial analysts, investors, and business consultants focusing on 17 Education & Technology Group Inc. (YQ).
Who Should Use This Product?
- Investors: Evaluate 17 Education & Technology Group Inc.'s (YQ) market position before making investment decisions.
- CFOs and Financial Analysts: Optimize valuation methodologies and assess financial forecasts for YQ.
- Startup Founders: Gain insights into how educational technology companies like 17 Education & Technology Group Inc. are valued.
- Consultants: Provide expert valuation analyses and reports for clients in the education sector.
- Students and Educators: Utilize current data to learn and teach valuation principles in the context of technology and education.
What the Template Contains
- Pre-Filled DCF Model: 17 Education & Technology Group Inc.'s (YQ) financial data preloaded for immediate use.
- WACC Calculator: Detailed calculations for Weighted Average Cost of Capital tailored to 17 Education & Technology Group Inc. (YQ).
- Financial Ratios: Assess 17 Education & Technology Group Inc.'s (YQ) profitability, leverage, and efficiency.
- Editable Inputs: Modify assumptions like growth rates, margins, and CAPEX to suit your scenarios.
- Financial Statements: Annual and quarterly reports for comprehensive analysis of 17 Education & Technology Group Inc. (YQ).
- Interactive Dashboard: Easily visualize key valuation metrics and results for 17 Education & Technology Group Inc. (YQ).
Disclaimer
All information, articles, and product details provided on this website are for general informational and educational purposes only. We do not claim any ownership over, nor do we intend to infringe upon, any trademarks, copyrights, logos, brand names, or other intellectual property mentioned or depicted on this site. Such intellectual property remains the property of its respective owners, and any references here are made solely for identification or informational purposes, without implying any affiliation, endorsement, or partnership.
We make no representations or warranties, express or implied, regarding the accuracy, completeness, or suitability of any content or products presented. Nothing on this website should be construed as legal, tax, investment, financial, medical, or other professional advice. In addition, no part of this site—including articles or product references—constitutes a solicitation, recommendation, endorsement, advertisement, or offer to buy or sell any securities, franchises, or other financial instruments, particularly in jurisdictions where such activity would be unlawful.
All content is of a general nature and may not address the specific circumstances of any individual or entity. It is not a substitute for professional advice or services. Any actions you take based on the information provided here are strictly at your own risk. You accept full responsibility for any decisions or outcomes arising from your use of this website and agree to release us from any liability in connection with your use of, or reliance upon, the content or products found herein.