
|
Zepp Health Corporation (ZEP) تقييم DCF |
Fully Editable: Tailor To Your Needs In Excel Or Sheets
Professional Design: Trusted, Industry-Standard Templates
Investor-Approved Valuation Models
MAC/PC Compatible, Fully Unlocked
No Expertise Is Needed; Easy To Follow
Zepp Health Corporation (ZEPP) Bundle
اكتشف القيمة الحقيقية لشركة Zepp Health Corporation مع حاسبة DCF المتقدمة! اضبط الافتراضات الرئيسية واستكشاف السيناريوهات المختلفة وتقييم كيفية تأثير المدخلات المختلفة على تقييم Zepp Health Corporation (ZEPP)-كل ذلك ضمن قالب Excel سهل الاستخدام.
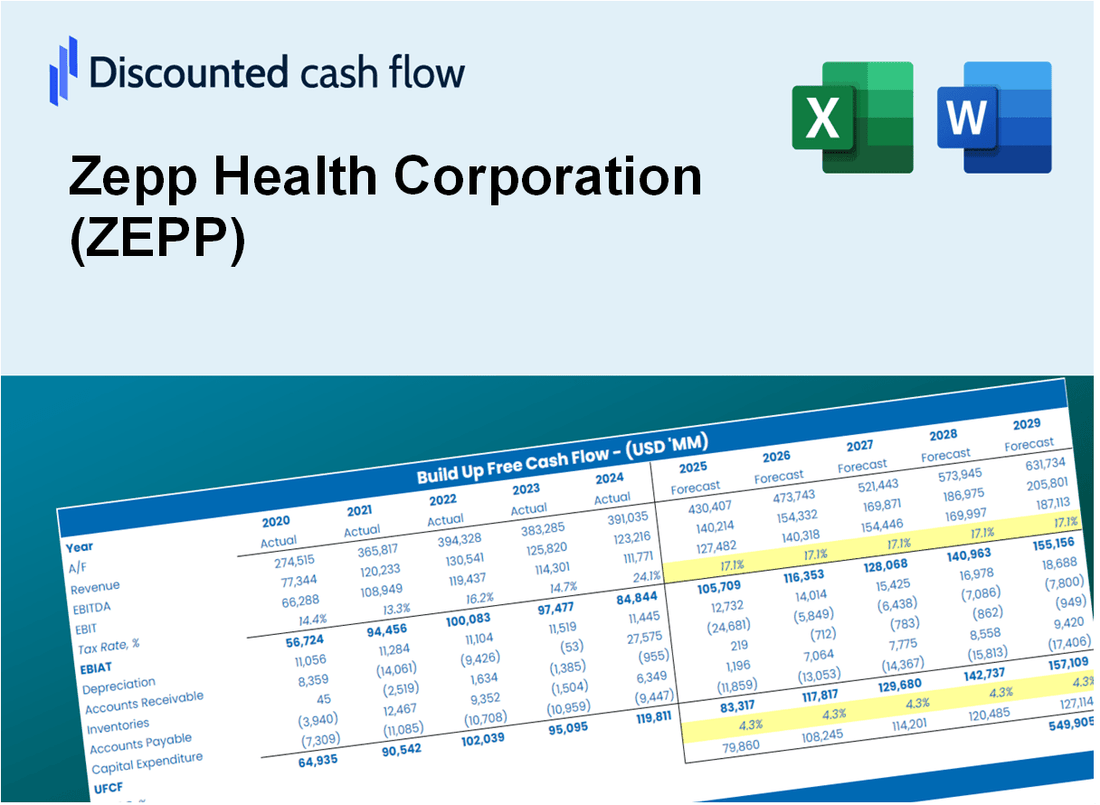
Discounted Cash Flow (DCF) - (USD MM)
| Year | AY1 2020 |
AY2 2021 |
AY3 2022 |
AY4 2023 |
AY5 2024 |
FY1 2025 |
FY2 2026 |
FY3 2027 |
FY4 2028 |
FY5 2029 |
|---|---|---|---|---|---|---|---|---|---|---|
| Revenue | 854.1 | 866.3 | 592.0 | 350.7 | 187.2 | 132.2 | 93.3 | 65.9 | 46.5 | 32.8 |
| Revenue Growth, % | 0 | 1.43 | -31.67 | -40.76 | -46.61 | -29.4 | -29.4 | -29.4 | -29.4 | -29.4 |
| EBITDA | 38.9 | 28.2 | -36.7 | -20.1 | -48.5 | -7.9 | -5.6 | -4.0 | -2.8 | -2.0 |
| EBITDA, % | 4.55 | 3.25 | -6.2 | -5.72 | -25.92 | -6.01 | -6.01 | -6.01 | -6.01 | -6.01 |
| Depreciation | 3.6 | 7.2 | 8.4 | 7.6 | 5.1 | 2.0 | 1.4 | 1.0 | .7 | .5 |
| Depreciation, % | 0.42169 | 0.83013 | 1.41 | 2.18 | 2.75 | 1.52 | 1.52 | 1.52 | 1.52 | 1.52 |
| EBIT | 35.3 | 21.0 | -45.1 | -27.7 | -53.7 | -9.9 | -7.0 | -5.0 | -3.5 | -2.5 |
| EBIT, % | 4.13 | 2.42 | -7.62 | -7.9 | -28.67 | -7.53 | -7.53 | -7.53 | -7.53 | -7.53 |
| Total Cash | 322.1 | 215.1 | 139.5 | 144.9 | 114.5 | 49.9 | 35.2 | 24.9 | 17.5 | 12.4 |
| Total Cash, percent | .0 | .0 | .0 | .0 | .0 | .0 | .0 | .0 | .0 | .0 |
| Account Receivables | 179.3 | 152.6 | 120.5 | 81.5 | 81.1 | 33.2 | 23.4 | 16.5 | 11.7 | 8.2 |
| Account Receivables, % | 21 | 17.61 | 20.35 | 23.25 | 43.32 | 25.11 | 25.11 | 25.11 | 25.11 | 25.11 |
| Inventories | 170.7 | 176.3 | 141.7 | 84.4 | 58.2 | 31.6 | 22.3 | 15.7 | 11.1 | 7.8 |
| Inventories, % | 19.99 | 20.35 | 23.93 | 24.08 | 31.09 | 23.89 | 23.89 | 23.89 | 23.89 | 23.89 |
| Accounts Payable | 273.4 | 184.8 | 63.2 | 37.1 | 52.3 | 27.1 | 19.1 | 13.5 | 9.5 | 6.7 |
| Accounts Payable, % | 32.01 | 21.33 | 10.68 | 10.58 | 27.96 | 20.51 | 20.51 | 20.51 | 20.51 | 20.51 |
| Capital Expenditure | -11.1 | -6.4 | -.2 | -.2 | -.2 | -.6 | -.4 | -.3 | -.2 | -.1 |
| Capital Expenditure, % | -1.3 | -0.73687 | -0.03496515 | -0.06722689 | -0.11174 | -0.44991 | -0.44991 | -0.44991 | -0.44991 | -0.44991 |
| Tax Rate, % | -22.17 | -22.17 | -22.17 | -22.17 | -22.17 | -22.17 | -22.17 | -22.17 | -22.17 | -22.17 |
| EBITAT | 30.9 | 19.6 | -36.6 | -25.8 | -65.6 | -9.1 | -6.4 | -4.5 | -3.2 | -2.3 |
| Depreciation | ||||||||||
| Changes in Account Receivables | ||||||||||
| Changes in Inventories | ||||||||||
| Changes in Accounts Payable | ||||||||||
| Capital Expenditure | ||||||||||
| UFCF | -53.2 | -47.1 | -83.3 | 51.7 | -18.7 | 41.7 | 5.7 | 4.0 | 2.8 | 2.0 |
| WACC, % | 4.09 | 4.27 | 3.87 | 4.26 | 4.49 | 4.2 | 4.2 | 4.2 | 4.2 | 4.2 |
| PV UFCF | ||||||||||
| SUM PV UFCF | 52.8 | |||||||||
| Long Term Growth Rate, % | 2.00 | |||||||||
| Free cash flow (T + 1) | 2 | |||||||||
| Terminal Value | 93 | |||||||||
| Present Terminal Value | 75 | |||||||||
| Enterprise Value | 128 | |||||||||
| Net Debt | 73 | |||||||||
| Equity Value | 55 | |||||||||
| Diluted Shares Outstanding, MM | 1 | |||||||||
| Equity Value Per Share | 54.44 |
What You Will Get
- Real ZEPP Financials: Access historical and projected data for precise valuation.
- Customizable Inputs: Adjust WACC, tax rates, revenue growth, and capital expenditures as needed.
- Dynamic Calculations: Intrinsic value and NPV are computed automatically.
- Scenario Analysis: Explore various scenarios to assess Zepp Health's future performance.
- User-Friendly Design: Designed for professionals while remaining approachable for newcomers.
Key Features
- Customizable Health Metrics: Adjust essential parameters such as user engagement, revenue per user, and operational costs.
- Instant Valuation Insights: Provides real-time calculations of intrinsic value, NPV, and other relevant metrics.
- High-Precision Estimates: Leverages Zepp Health's actual performance data for accurate valuation results.
- Streamlined Scenario Testing: Easily explore various assumptions and analyze different outcomes.
- Efficiency Booster: Avoid the complexity of constructing intricate valuation models from the ground up.
How It Works
- Download: Obtain the pre-built Excel file containing Zepp Health Corporation’s (ZEPP) financial data.
- Customize: Modify forecasts, such as revenue growth, EBITDA %, and WACC as needed.
- Update Automatically: The intrinsic value and NPV calculations refresh in real-time.
- Test Scenarios: Develop various projections and analyze outcomes immediately.
- Make Decisions: Leverage the valuation results to inform your investment approach.
Why Choose This Calculator for Zepp Health Corporation (ZEPP)?
- All-in-One Solution: Features DCF, WACC, and financial ratio analyses tailored for Zepp Health Corporation.
- Flexible Inputs: Modify yellow-highlighted cells to explore different financial scenarios.
- In-Depth Analysis: Automatically computes Zepp Health's intrinsic value and Net Present Value.
- Preloaded Metrics: Historical and projected data provide a solid foundation for analysis.
- Expert-Level Tool: Perfect for financial analysts, investors, and business consultants focusing on Zepp Health Corporation.
Who Should Use This Product?
- Investors: Evaluate Zepp Health Corporation’s (ZEPP) market position before making investment decisions.
- CFOs and Financial Analysts: Optimize valuation methodologies and assess financial forecasts.
- Startup Founders: Understand the valuation strategies of established companies like Zepp Health.
- Consultants: Provide detailed valuation analyses and reports for clients in the health tech sector.
- Students and Educators: Utilize current data to practice and instruct on valuation practices in the healthcare industry.
What the Template Contains
- Pre-Filled Data: Includes Zepp Health Corporation’s historical financials and forecasts.
- Discounted Cash Flow Model: Editable DCF valuation model with automatic calculations.
- Weighted Average Cost of Capital (WACC): A dedicated sheet for calculating WACC based on custom inputs.
- Key Financial Ratios: Analyze Zepp Health Corporation’s profitability, efficiency, and leverage.
- Customizable Inputs: Edit revenue growth, margins, and tax rates with ease.
- Clear Dashboard: Charts and tables summarizing key valuation results.
Disclaimer
All information, articles, and product details provided on this website are for general informational and educational purposes only. We do not claim any ownership over, nor do we intend to infringe upon, any trademarks, copyrights, logos, brand names, or other intellectual property mentioned or depicted on this site. Such intellectual property remains the property of its respective owners, and any references here are made solely for identification or informational purposes, without implying any affiliation, endorsement, or partnership.
We make no representations or warranties, express or implied, regarding the accuracy, completeness, or suitability of any content or products presented. Nothing on this website should be construed as legal, tax, investment, financial, medical, or other professional advice. In addition, no part of this site—including articles or product references—constitutes a solicitation, recommendation, endorsement, advertisement, or offer to buy or sell any securities, franchises, or other financial instruments, particularly in jurisdictions where such activity would be unlawful.
All content is of a general nature and may not address the specific circumstances of any individual or entity. It is not a substitute for professional advice or services. Any actions you take based on the information provided here are strictly at your own risk. You accept full responsibility for any decisions or outcomes arising from your use of this website and agree to release us from any liability in connection with your use of, or reliance upon, the content or products found herein.