
|
Zoom Video Communications ، Inc. (ZM) DCF تقييم |
Fully Editable: Tailor To Your Needs In Excel Or Sheets
Professional Design: Trusted, Industry-Standard Templates
Investor-Approved Valuation Models
MAC/PC Compatible, Fully Unlocked
No Expertise Is Needed; Easy To Follow
Zoom Video Communications, Inc. (ZM) Bundle
تبحث لتقييم القيمة الجوهرية ل Zoom Video Communications ، Inc.؟ يدمج حاسبة DCF (ZM) DCF بيانات العالم الحقيقي مع ميزات تخصيص واسعة ، مما يتيح لك تحسين توقعاتك وتعزيز اختيارات الاستثمار الخاصة بك.
Discounted Cash Flow (DCF) - (USD MM)
| Year | AY1 2021 |
AY2 2022 |
AY3 2023 |
AY4 2024 |
AY5 2025 |
FY1 2026 |
FY2 2027 |
FY3 2028 |
FY4 2029 |
FY5 2030 |
|---|---|---|---|---|---|---|---|---|---|---|
| Revenue | 2,651.4 | 4,099.9 | 4,393.0 | 4,527.2 | 4,665.4 | 5,301.3 | 6,023.7 | 6,844.7 | 7,777.5 | 8,837.5 |
| Revenue Growth, % | 0 | 54.63 | 7.15 | 3.06 | 3.05 | 13.63 | 13.63 | 13.63 | 13.63 | 13.63 |
| EBITDA | 688.7 | 1,111.8 | 327.8 | 629.7 | 935.9 | 1,002.2 | 1,138.8 | 1,294.0 | 1,470.3 | 1,670.7 |
| EBITDA, % | 25.98 | 27.12 | 7.46 | 13.91 | 20.06 | 18.9 | 18.9 | 18.9 | 18.9 | 18.9 |
| Depreciation | 28.9 | 48.2 | 82.3 | 104.5 | 122.6 | 96.2 | 109.3 | 124.2 | 141.1 | 160.4 |
| Depreciation, % | 1.09 | 1.18 | 1.87 | 2.31 | 2.63 | 1.81 | 1.81 | 1.81 | 1.81 | 1.81 |
| EBIT | 659.8 | 1,063.6 | 245.4 | 525.3 | 813.3 | 906.0 | 1,029.5 | 1,169.8 | 1,329.2 | 1,510.3 |
| EBIT, % | 24.89 | 25.94 | 5.59 | 11.6 | 17.43 | 17.09 | 17.09 | 17.09 | 17.09 | 17.09 |
| Total Cash | 4,244.7 | 5,419.3 | 5,412.7 | 6,962.5 | 7,791.7 | 5,301.3 | 6,023.7 | 6,844.7 | 7,777.5 | 8,837.5 |
| Total Cash, percent | .0 | .0 | .0 | .0 | .0 | .0 | .0 | .0 | .0 | .0 |
| Account Receivables | 294.7 | 419.7 | 557.4 | 536.1 | 495.2 | 599.0 | 680.6 | 773.4 | 878.8 | 998.6 |
| Account Receivables, % | 11.12 | 10.24 | 12.69 | 11.84 | 10.61 | 11.3 | 11.3 | 11.3 | 11.3 | 11.3 |
| Inventories | .0 | .0 | .0 | .0 | .0 | .0 | .0 | .0 | .0 | .0 |
| Inventories, % | 0 | 0 | 0 | 0 | 0 | 0 | 0 | 0 | 0 | 0 |
| Accounts Payable | 8.7 | 7.8 | 14.4 | 10.2 | 8.3 | 13.3 | 15.1 | 17.1 | 19.4 | 22.1 |
| Accounts Payable, % | 0.32677 | 0.19125 | 0.32812 | 0.22475 | 0.17887 | 0.24995 | 0.24995 | 0.24995 | 0.24995 | 0.24995 |
| Capital Expenditure | -85.8 | -145.6 | -115.1 | -127.0 | -136.6 | -160.5 | -182.4 | -207.2 | -235.5 | -267.6 |
| Capital Expenditure, % | -3.24 | -3.55 | -2.62 | -2.8 | -2.93 | -3.03 | -3.03 | -3.03 | -3.03 | -3.03 |
| Tax Rate, % | 23.21 | 23.21 | 23.21 | 23.21 | 23.21 | 23.21 | 23.21 | 23.21 | 23.21 | 23.21 |
| EBITAT | 654.3 | 1,328.1 | 102.1 | 402.3 | 624.5 | 714.2 | 811.5 | 922.1 | 1,047.8 | 1,190.6 |
| Depreciation | ||||||||||
| Changes in Account Receivables | ||||||||||
| Changes in Inventories | ||||||||||
| Changes in Accounts Payable | ||||||||||
| Capital Expenditure | ||||||||||
| UFCF | 311.3 | 1,104.9 | -61.8 | 396.9 | 649.6 | 551.0 | 658.6 | 748.4 | 850.4 | 966.2 |
| WACC, % | 7.37 | 7.37 | 7.36 | 7.37 | 7.37 | 7.37 | 7.37 | 7.37 | 7.37 | 7.37 |
| PV UFCF | ||||||||||
| SUM PV UFCF | 3,006.3 | |||||||||
| Long Term Growth Rate, % | 4.00 | |||||||||
| Free cash flow (T + 1) | 1,005 | |||||||||
| Terminal Value | 29,845 | |||||||||
| Present Terminal Value | 20,918 | |||||||||
| Enterprise Value | 23,924 | |||||||||
| Net Debt | -1,285 | |||||||||
| Equity Value | 25,209 | |||||||||
| Diluted Shares Outstanding, MM | 315 | |||||||||
| Equity Value Per Share | 80.01 |
What You Will Get
- Editable Excel Template: A fully customizable Excel-based DCF Calculator featuring pre-filled real ZM financials.
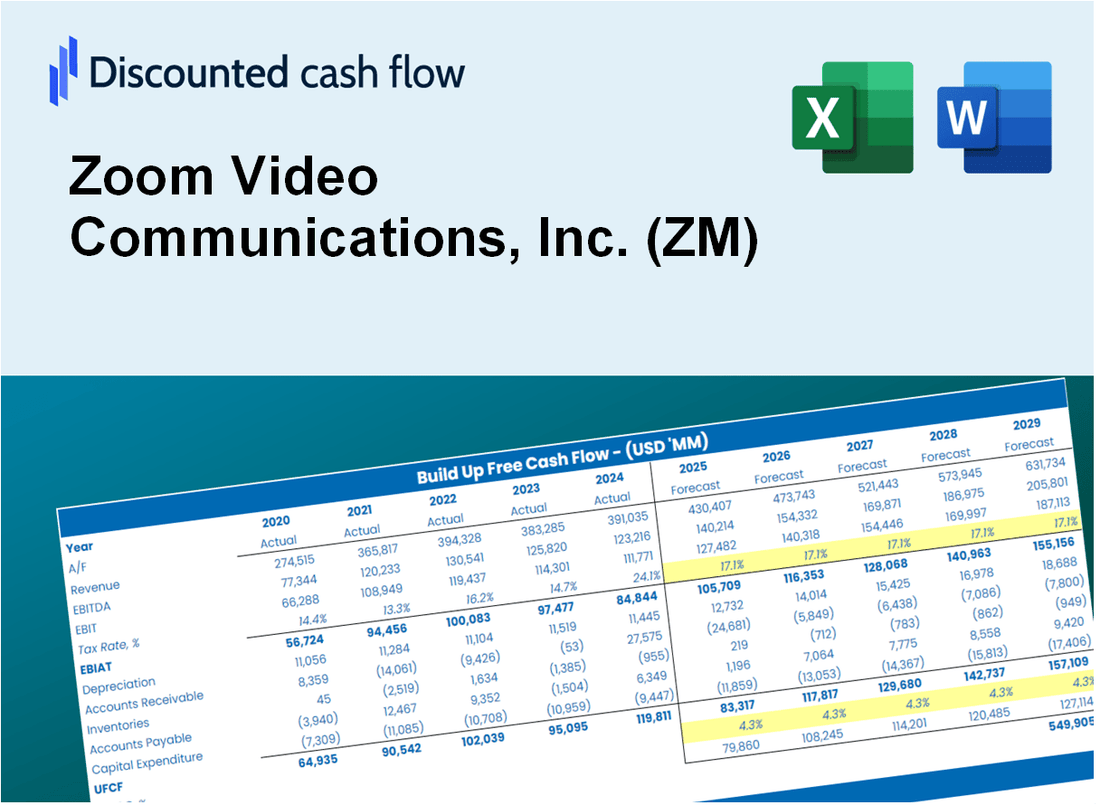
- Real-World Data: Historical data and forward-looking estimates (as indicated in the yellow cells).
- Forecast Flexibility: Adjust forecast assumptions such as revenue growth, EBITDA %, and WACC.
- Automatic Calculations: Instantly observe how your inputs affect Zoom's valuation.
- Professional Tool: Designed for investors, CFOs, consultants, and financial analysts.
- User-Friendly Design: Organized for clarity and ease of use, complete with step-by-step instructions.
Key Features
- Comprehensive Financial Data: Gain access to precise pre-loaded historical figures and future forecasts for Zoom Video Communications, Inc. (ZM).
- Adjustable Forecast Parameters: Modify highlighted fields such as WACC, growth rates, and profit margins to suit your analysis.
- Real-Time Calculations: Automatic recalculations for DCF, Net Present Value (NPV), and cash flow assessments.
- User-Friendly Dashboard: Intuitive charts and summaries for a clear visualization of your valuation outcomes.
- Designed for All Skill Levels: An accessible and straightforward layout tailored for investors, CFOs, and consultants alike.
How It Works
- 1. Access the Template: Download and open the Excel file containing Zoom Video Communications, Inc.'s (ZM) preloaded data.
- 2. Modify Assumptions: Adjust key inputs such as growth rates, WACC, and capital expenditures.
- 3. View Results Instantly: The DCF model automatically calculates intrinsic value and NPV in real-time.
- 4. Explore Scenarios: Analyze various forecasts to evaluate different valuation outcomes.
- 5. Present with Assurance: Deliver professional valuation insights to back your decisions.
Why Choose This Calculator for Zoom Video Communications (ZM)?
- Accurate Data: Up-to-date Zoom financials provide dependable valuation outcomes.
- Customizable: Modify essential factors such as growth rates, WACC, and tax rates to align with your forecasts.
- Time-Saving: Ready-made calculations save you from starting from the ground up.
- Professional-Grade Tool: Tailored for investors, analysts, and consultants in the tech sector.
- User-Friendly: Simple design and step-by-step guidance make it accessible for all users.
Who Should Use This Product?
- Remote Workers: Enhance your communication skills and collaborate effectively using Zoom's features.
- Educators: Integrate virtual classrooms and interactive lessons into your teaching methods.
- Corporate Teams: Improve productivity with seamless video conferencing and team collaboration tools.
- Event Planners: Host webinars and large virtual events with ease, reaching a wider audience.
- Healthcare Professionals: Utilize telehealth services to connect with patients remotely and provide care.
What the Template Contains
- Pre-Filled DCF Model: Zoom Video Communications, Inc.'s (ZM) financial data preloaded for immediate use.
- WACC Calculator: Detailed calculations for Weighted Average Cost of Capital.
- Financial Ratios: Evaluate Zoom's profitability, leverage, and efficiency.
- Editable Inputs: Change assumptions such as growth, margins, and CAPEX to fit your scenarios.
- Financial Statements: Annual and quarterly reports to support detailed analysis.
- Interactive Dashboard: Easily visualize key valuation metrics and results.
Disclaimer
All information, articles, and product details provided on this website are for general informational and educational purposes only. We do not claim any ownership over, nor do we intend to infringe upon, any trademarks, copyrights, logos, brand names, or other intellectual property mentioned or depicted on this site. Such intellectual property remains the property of its respective owners, and any references here are made solely for identification or informational purposes, without implying any affiliation, endorsement, or partnership.
We make no representations or warranties, express or implied, regarding the accuracy, completeness, or suitability of any content or products presented. Nothing on this website should be construed as legal, tax, investment, financial, medical, or other professional advice. In addition, no part of this site—including articles or product references—constitutes a solicitation, recommendation, endorsement, advertisement, or offer to buy or sell any securities, franchises, or other financial instruments, particularly in jurisdictions where such activity would be unlawful.
All content is of a general nature and may not address the specific circumstances of any individual or entity. It is not a substitute for professional advice or services. Any actions you take based on the information provided here are strictly at your own risk. You accept full responsibility for any decisions or outcomes arising from your use of this website and agree to release us from any liability in connection with your use of, or reliance upon, the content or products found herein.