
|
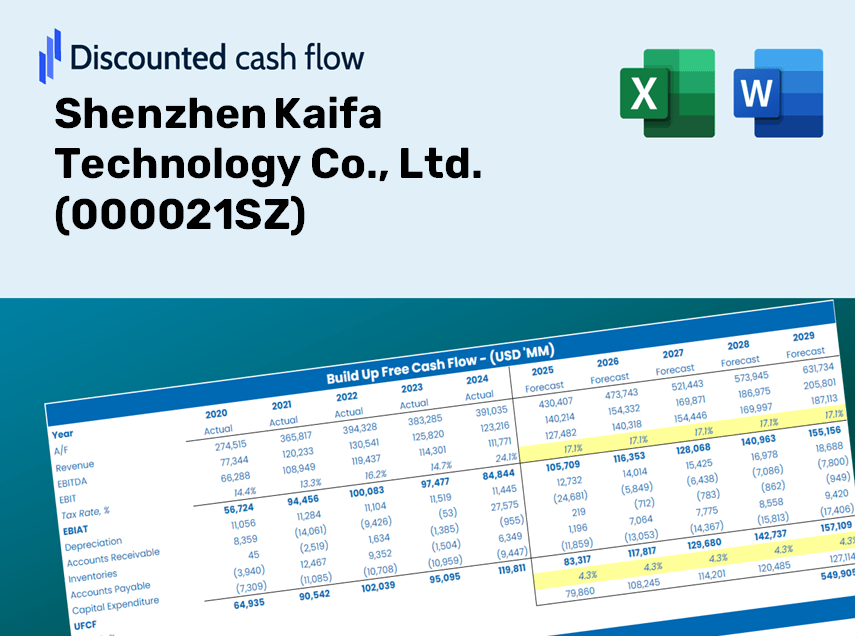
Shenzhen Kaifa Technology Co., Ltd. (000021.sz) DCF -Bewertung |
Fully Editable: Tailor To Your Needs In Excel Or Sheets
Professional Design: Trusted, Industry-Standard Templates
Investor-Approved Valuation Models
MAC/PC Compatible, Fully Unlocked
No Expertise Is Needed; Easy To Follow
Shenzhen Kaifa Technology Co., Ltd. (000021.SZ) Bundle
Unabhängig davon, ob Sie Investor oder Analyst sind, dient dieser (000021SZ) DCF-Taschenrechner als Anlaufstelle für eine genaue Bewertung. Mit echten Daten von Shenzhen Kaifa Technology Co., Ltd. können Sie problemlos Prognosen anpassen und die Auswirkungen in Echtzeit beobachten.
Discounted Cash Flow (DCF) - (USD MM)
| Year | AY1 2020 |
AY2 2021 |
AY3 2022 |
AY4 2023 |
AY5 2024 |
FY1 2025 |
FY2 2026 |
FY3 2027 |
FY4 2028 |
FY5 2029 |
|---|---|---|---|---|---|---|---|---|---|---|
| Revenue | 14,967.2 | 16,488.3 | 16,118.4 | 14,264.6 | 14,827.2 | 14,840.6 | 14,854.0 | 14,867.4 | 14,880.9 | 14,894.3 |
| Revenue Growth, % | 0 | 10.16 | -2.24 | -11.5 | 3.94 | 0.09044378 | 0.09044378 | 0.09044378 | 0.09044378 | 0.09044378 |
| EBITDA | 1,893.5 | 1,846.3 | 1,513.5 | 1,874.2 | 1,814.5 | 1,739.8 | 1,741.3 | 1,742.9 | 1,744.5 | 1,746.1 |
| EBITDA, % | 12.65 | 11.2 | 9.39 | 13.14 | 12.24 | 11.72 | 11.72 | 11.72 | 11.72 | 11.72 |
| Depreciation | 628.6 | 564.8 | 525.3 | 639.8 | 648.1 | 585.9 | 586.4 | 587.0 | 587.5 | 588.0 |
| Depreciation, % | 4.2 | 3.43 | 3.26 | 4.49 | 4.37 | 3.95 | 3.95 | 3.95 | 3.95 | 3.95 |
| EBIT | 1,264.9 | 1,281.5 | 988.2 | 1,234.4 | 1,166.5 | 1,153.9 | 1,154.9 | 1,155.9 | 1,157.0 | 1,158.0 |
| EBIT, % | 8.45 | 7.77 | 6.13 | 8.65 | 7.87 | 7.77 | 7.77 | 7.77 | 7.77 | 7.77 |
| Total Cash | 7,494.0 | 8,545.2 | 8,897.2 | 7,723.3 | 7,321.9 | 7,735.5 | 7,742.5 | 7,749.5 | 7,756.5 | 7,763.5 |
| Total Cash, percent | .0 | .0 | .0 | .0 | .0 | .0 | .0 | .0 | .0 | .0 |
| Account Receivables | 3,107.7 | 3,655.3 | 2,744.4 | 3,954.6 | 4,073.9 | 3,418.0 | 3,421.1 | 3,424.2 | 3,427.3 | 3,430.4 |
| Account Receivables, % | 20.76 | 22.17 | 17.03 | 27.72 | 27.48 | 23.03 | 23.03 | 23.03 | 23.03 | 23.03 |
| Inventories | 2,367.4 | 3,545.5 | 4,522.9 | 3,525.9 | 2,629.8 | 3,200.6 | 3,203.5 | 3,206.4 | 3,209.3 | 3,212.2 |
| Inventories, % | 15.82 | 21.5 | 28.06 | 24.72 | 17.74 | 21.57 | 21.57 | 21.57 | 21.57 | 21.57 |
| Accounts Payable | 2,182.1 | 3,135.7 | 950.2 | 2,078.4 | 3,508.7 | 2,307.0 | 2,309.1 | 2,311.2 | 2,313.3 | 2,315.4 |
| Accounts Payable, % | 14.58 | 19.02 | 5.9 | 14.57 | 23.66 | 15.55 | 15.55 | 15.55 | 15.55 | 15.55 |
| Capital Expenditure | -1,942.4 | -2,830.4 | -1,884.5 | -1,086.6 | -1,431.7 | -1,754.4 | -1,756.0 | -1,757.6 | -1,759.2 | -1,760.8 |
| Capital Expenditure, % | -12.98 | -17.17 | -11.69 | -7.62 | -9.66 | -11.82 | -11.82 | -11.82 | -11.82 | -11.82 |
| Tax Rate, % | 27.6 | 27.6 | 27.6 | 27.6 | 27.6 | 27.6 | 27.6 | 27.6 | 27.6 | 27.6 |
| EBITAT | 968.1 | 971.0 | 806.2 | 802.8 | 844.6 | 856.9 | 857.7 | 858.5 | 859.3 | 860.0 |
| Depreciation | ||||||||||
| Changes in Account Receivables | ||||||||||
| Changes in Inventories | ||||||||||
| Changes in Accounts Payable | ||||||||||
| Capital Expenditure | ||||||||||
| UFCF | -3,638.8 | -2,066.8 | -2,805.0 | 1,271.1 | 2,267.9 | -1,428.3 | -315.8 | -316.1 | -316.4 | -316.6 |
| WACC, % | 6.06 | 6.06 | 6.09 | 6 | 6.04 | 6.05 | 6.05 | 6.05 | 6.05 | 6.05 |
| PV UFCF | ||||||||||
| SUM PV UFCF | -2,378.8 | |||||||||
| Long Term Growth Rate, % | 3.00 | |||||||||
| Free cash flow (T + 1) | -326 | |||||||||
| Terminal Value | -10,700 | |||||||||
| Present Terminal Value | -7,978 | |||||||||
| Enterprise Value | -10,357 | |||||||||
| Net Debt | -211 | |||||||||
| Equity Value | -10,145 | |||||||||
| Diluted Shares Outstanding, MM | 1,560 | |||||||||
| Equity Value Per Share | -6.50 |
What You Will Receive
- Accurate 000021SZ Financials: Features both historical and projected data for precise valuation.
- Customizable Inputs: Adjust metrics such as WACC, tax rates, revenue growth, and capital expenditures.
- Automated Calculations: Intrinsic value and NPV are computed in real-time.
- Scenario Analysis: Explore various scenarios to assess Shenzhen Kaifa Technology’s future performance.
- User-Friendly Design: Designed for experts while remaining accessible to newcomers.
Key Features
- Customizable Forecast Inputs: Adjust essential factors such as revenue growth, EBITDA %, and capital expenditures.
- Instant DCF Valuation: Provides immediate calculations of intrinsic value, NPV, and other financial metrics.
- High-Quality Accuracy: Leverages Shenzhen Kaifa Technology Co., Ltd.'s (000021SZ) real-world financial data for precise valuation results.
- Effortless Scenario Analysis: Easily simulate different assumptions and evaluate various outcomes.
- Efficiency Enhancer: Streamlines the valuation process, removing the necessity for complex models from the ground up.
How It Operates
- 1. Access the Template: Download and open the Excel file featuring Shenzhen Kaifa Technology Co., Ltd.'s (000021SZ) preloaded data.
- 2. Modify Assumptions: Adjust crucial inputs such as growth rates, WACC, and capital expenditures.
- 3. See Results Immediately: The DCF model automatically calculates intrinsic value and NPV.
- 4. Experiment with Scenarios: Evaluate various forecasts to assess different valuation results.
- 5. Present with Assurance: Deliver professional valuation insights to reinforce your decision-making.
Why Opt for This Calculator?
- Designed for Experts: A sophisticated tool favored by analysts, CFOs, and consultants.
- Accurate Data: Historical and projected financial information for Shenzhen Kaifa Technology Co., Ltd. (000021SZ) preloaded for precise analysis.
- Flexible Scenario Testing: Effortlessly simulate various forecasts and assumptions.
- Clear Results: Automatically computes intrinsic value, NPV, and crucial metrics.
- User-Friendly: Step-by-step guidance takes you through every aspect of the process.
Who Should Utilize This Product?
- Institutional Investors: Develop comprehensive and accurate valuation models for assessing investment opportunities in Shenzhen Kaifa Technology Co., Ltd. (000021SZ).
- Corporate Strategy Teams: Evaluate valuation scenarios to inform key business decisions and strategies.
- Financial Consultants and Advisors: Deliver precise valuation insights to clients targeting Shenzhen Kaifa Technology Co., Ltd. (000021SZ) stock.
- Students and Professors: Leverage real market data to enhance skills in financial modeling and analysis.
- Technology Aficionados: Gain insights into the market valuation of technology firms like Shenzhen Kaifa Technology Co., Ltd. (000021SZ).
Contents of the Template
- Operating and Balance Sheet Data: Pre-filled historical data and forecasts for Shenzhen Kaifa Technology Co., Ltd. (000021SZ), including revenue, EBITDA, EBIT, and capital expenditures.
- WACC Calculation: A dedicated sheet for Weighted Average Cost of Capital (WACC), encompassing parameters such as Beta, risk-free rate, and share price.
- DCF Valuation (Unlevered and Levered): Customizable Discounted Cash Flow models that display intrinsic value with comprehensive calculations.
- Financial Statements: Pre-loaded annual and quarterly financial statements to facilitate thorough analysis.
- Key Ratios: Includes profitability, leverage, and efficiency ratios specific to Shenzhen Kaifa Technology Co., Ltd. (000021SZ).
- Dashboard and Charts: A visual overview of valuation outputs and assumptions for easy result analysis.
Disclaimer
All information, articles, and product details provided on this website are for general informational and educational purposes only. We do not claim any ownership over, nor do we intend to infringe upon, any trademarks, copyrights, logos, brand names, or other intellectual property mentioned or depicted on this site. Such intellectual property remains the property of its respective owners, and any references here are made solely for identification or informational purposes, without implying any affiliation, endorsement, or partnership.
We make no representations or warranties, express or implied, regarding the accuracy, completeness, or suitability of any content or products presented. Nothing on this website should be construed as legal, tax, investment, financial, medical, or other professional advice. In addition, no part of this site—including articles or product references—constitutes a solicitation, recommendation, endorsement, advertisement, or offer to buy or sell any securities, franchises, or other financial instruments, particularly in jurisdictions where such activity would be unlawful.
All content is of a general nature and may not address the specific circumstances of any individual or entity. It is not a substitute for professional advice or services. Any actions you take based on the information provided here are strictly at your own risk. You accept full responsibility for any decisions or outcomes arising from your use of this website and agree to release us from any liability in connection with your use of, or reliance upon, the content or products found herein.