
|
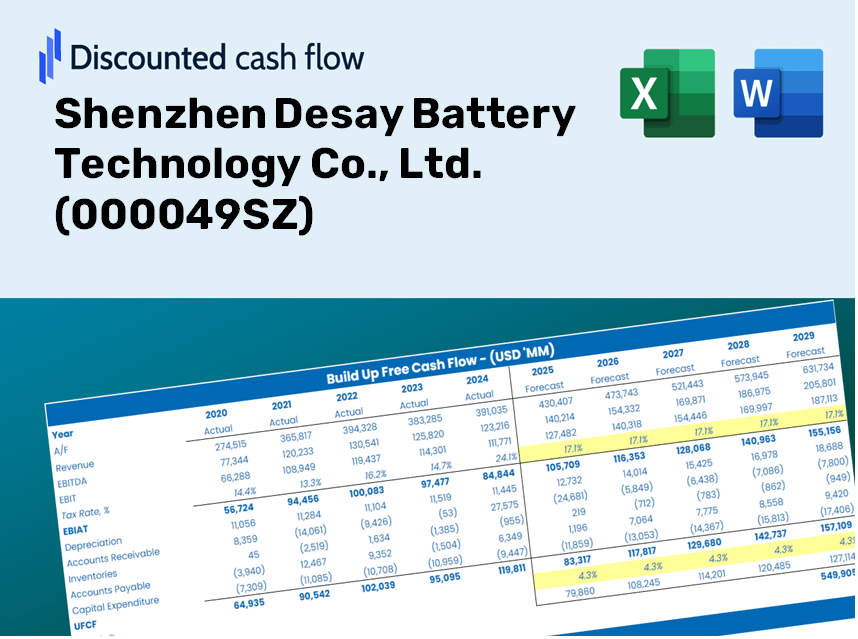
Shenzhen Desay Battery Technology Co., Ltd. (000049.SZ) DCF -Bewertung |
Fully Editable: Tailor To Your Needs In Excel Or Sheets
Professional Design: Trusted, Industry-Standard Templates
Investor-Approved Valuation Models
MAC/PC Compatible, Fully Unlocked
No Expertise Is Needed; Easy To Follow
Shenzhen Desay Battery Technology Co., Ltd. (000049.SZ) Bundle
Sparen Sie Zeit und verbessern Sie die Präzision mit unserem DCF -Taschenrechner (000049sz)! Mithilfe realer Daten von Shenzhen Desay Battery Technology Co., Ltd. und anpassbaren Annahmen können Sie Ihre Investitionen wie einen erfahrenen Fachmann prognostizieren, analysieren und bewerten.
Discounted Cash Flow (DCF) - (USD MM)
| Year | AY1 2020 |
AY2 2021 |
AY3 2022 |
AY4 2023 |
AY5 2024 |
FY1 2025 |
FY2 2026 |
FY3 2027 |
FY4 2028 |
FY5 2029 |
|---|---|---|---|---|---|---|---|---|---|---|
| Revenue | 19,397.8 | 19,470.9 | 21,749.1 | 20,284.9 | 20,859.3 | 21,285.6 | 21,720.7 | 22,164.7 | 22,617.8 | 23,080.2 |
| Revenue Growth, % | 0 | 0.37648 | 11.7 | -6.73 | 2.83 | 2.04 | 2.04 | 2.04 | 2.04 | 2.04 |
| EBITDA | 1,160.4 | 1,186.6 | 1,220.1 | 1,038.2 | 919.5 | 1,158.5 | 1,182.2 | 1,206.3 | 1,231.0 | 1,256.1 |
| EBITDA, % | 5.98 | 6.09 | 5.61 | 5.12 | 4.41 | 5.44 | 5.44 | 5.44 | 5.44 | 5.44 |
| Depreciation | 229.9 | 251.5 | 282.1 | 478.5 | 608.3 | 385.2 | 393.1 | 401.1 | 409.3 | 417.7 |
| Depreciation, % | 1.19 | 1.29 | 1.3 | 2.36 | 2.92 | 1.81 | 1.81 | 1.81 | 1.81 | 1.81 |
| EBIT | 930.5 | 935.0 | 938.1 | 559.7 | 311.2 | 773.2 | 789.1 | 805.2 | 821.6 | 838.4 |
| EBIT, % | 4.8 | 4.8 | 4.31 | 2.76 | 1.49 | 3.63 | 3.63 | 3.63 | 3.63 | 3.63 |
| Total Cash | 551.7 | 271.0 | 713.2 | 3,721.8 | 2,626.4 | 1,637.0 | 1,670.5 | 1,704.6 | 1,739.5 | 1,775.0 |
| Total Cash, percent | .0 | .0 | .0 | .0 | .0 | .0 | .0 | .0 | .0 | .0 |
| Account Receivables | 4,703.4 | 5,163.5 | 4,683.4 | 5,266.5 | 6,418.2 | 5,493.0 | 5,605.3 | 5,719.9 | 5,836.8 | 5,956.1 |
| Account Receivables, % | 24.25 | 26.52 | 21.53 | 25.96 | 30.77 | 25.81 | 25.81 | 25.81 | 25.81 | 25.81 |
| Inventories | 1,699.3 | 2,583.1 | 2,914.7 | 2,090.0 | 2,201.4 | 2,396.1 | 2,445.1 | 2,495.1 | 2,546.1 | 2,598.1 |
| Inventories, % | 8.76 | 13.27 | 13.4 | 10.3 | 10.55 | 11.26 | 11.26 | 11.26 | 11.26 | 11.26 |
| Accounts Payable | 4,460.0 | 5,141.6 | 3,593.5 | 4,573.7 | 5,455.7 | 4,879.7 | 4,979.4 | 5,081.2 | 5,185.1 | 5,291.0 |
| Accounts Payable, % | 22.99 | 26.41 | 16.52 | 22.55 | 26.15 | 22.92 | 22.92 | 22.92 | 22.92 | 22.92 |
| Capital Expenditure | -674.5 | -730.0 | -1,469.9 | -1,825.5 | -1,178.7 | -1,219.0 | -1,243.9 | -1,269.4 | -1,295.3 | -1,321.8 |
| Capital Expenditure, % | -3.48 | -3.75 | -6.76 | -9 | -5.65 | -5.73 | -5.73 | -5.73 | -5.73 | -5.73 |
| Tax Rate, % | -14.39 | -14.39 | -14.39 | -14.39 | -14.39 | -14.39 | -14.39 | -14.39 | -14.39 | -14.39 |
| EBITAT | 677.6 | 781.1 | 821.3 | 583.9 | 356.0 | 686.5 | 700.5 | 714.8 | 729.4 | 744.4 |
| Depreciation | ||||||||||
| Changes in Account Receivables | ||||||||||
| Changes in Inventories | ||||||||||
| Changes in Accounts Payable | ||||||||||
| Capital Expenditure | ||||||||||
| UFCF | -1,709.7 | -359.6 | -1,766.2 | 458.6 | -595.5 | 7.1 | -211.8 | -216.2 | -220.6 | -225.1 |
| WACC, % | 6.67 | 6.81 | 6.86 | 7.02 | 7.02 | 6.87 | 6.87 | 6.87 | 6.87 | 6.87 |
| PV UFCF | ||||||||||
| SUM PV UFCF | -686.4 | |||||||||
| Long Term Growth Rate, % | 2.00 | |||||||||
| Free cash flow (T + 1) | -230 | |||||||||
| Terminal Value | -4,711 | |||||||||
| Present Terminal Value | -3,379 | |||||||||
| Enterprise Value | -4,065 | |||||||||
| Net Debt | 2,304 | |||||||||
| Equity Value | -6,370 | |||||||||
| Diluted Shares Outstanding, MM | 385 | |||||||||
| Equity Value Per Share | -16.56 |
Benefits You Will Receive
- Comprehensive Financial Model: Leverage Shenzhen Desay Battery Technology Co., Ltd.'s actual data for accurate DCF valuation.
- Complete Forecast Customization: Modify revenue growth, profit margins, WACC, and other critical factors.
- Real-Time Calculations: Automatic updates enable you to view outcomes instantly as adjustments are made.
- Professional-Quality Template: An expertly crafted Excel file suitable for high-level valuation.
- Flexible and Reusable: Designed for adaptability, allowing for ongoing use in detailed forecasting.
Key Features
- 🔍 Real-Life 000049SZ Financials: Pre-filled historical and projected data for Shenzhen Desay Battery Technology Co., Ltd.
- ✏️ Fully Customizable Inputs: Modify all essential parameters (yellow cells) such as WACC, growth %, and tax rates.
- 📊 Professional DCF Valuation: Integrated formulas calculate Shenzhen Desay's intrinsic value using the Discounted Cash Flow method.
- ⚡ Instant Results: View Shenzhen Desay’s valuation immediately after making adjustments.
- Scenario Analysis: Evaluate and compare potential outcomes based on different financial assumptions side-by-side.
How It Works
- Step 1: Download the Excel file.
- Step 2: Examine the pre-filled data for Shenzhen Desay Battery Technology Co., Ltd. (000049SZ) (historical and projected).
- Step 3: Modify key assumptions (highlighted in yellow) according to your analysis.
- Step 4: Observe the automatic recalculations for the intrinsic value of Shenzhen Desay Battery Technology Co., Ltd. (000049SZ).
- Step 5: Utilize the results for your investment decisions or reporting needs.
Why Choose Shenzhen Desay Battery Technology Co., Ltd. (000049SZ)?
- Time-Efficient: No need to build a financial model from the ground up – our tools are ready for immediate use.
- Enhanced Accuracy: Dependable financial data and calculations minimize valuation errors.
- Completely Customizable: Adjust the model to align with your specific assumptions and forecasts.
- User-Friendly: Intuitive charts and outputs simplify result interpretation.
- Preferred by Professionals: Created for industry experts who prioritize accuracy and practicality.
Who Can Benefit from Our Solutions?
- Engineering Students: Acquire hands-on experience with battery technology and apply theoretical knowledge to real-world scenarios.
- Researchers: Integrate advanced battery models into your studies and foster innovation in energy storage.
- Investors: Validate your investment strategies by analyzing the performance metrics of Shenzhen Desay Battery Technology Co., Ltd. (000049SZ).
- Industry Analysts: Enhance your analysis process with our ready-to-use and customizable battery performance models.
- Entrepreneurs: Understand the evaluation methods used for large-scale battery manufacturers like Shenzhen Desay Battery Technology Co., Ltd. (000049SZ).
What the Template Includes
- Preloaded 000049SZ Data: Historical and projected financial metrics, such as revenue, EBIT, and capital expenditures.
- DCF and WACC Models: Advanced spreadsheets for calculating intrinsic value and Weighted Average Cost of Capital.
- Editable Inputs: Yellow-highlighted cells for customizing revenue growth, tax rates, and discount rates.
- Financial Statements: Detailed annual and quarterly financials for thorough analysis.
- Key Ratios: Metrics for profitability, leverage, and efficiency to assess performance.
- Dashboard and Charts: Visual representations of valuation results and assumptions.
Disclaimer
All information, articles, and product details provided on this website are for general informational and educational purposes only. We do not claim any ownership over, nor do we intend to infringe upon, any trademarks, copyrights, logos, brand names, or other intellectual property mentioned or depicted on this site. Such intellectual property remains the property of its respective owners, and any references here are made solely for identification or informational purposes, without implying any affiliation, endorsement, or partnership.
We make no representations or warranties, express or implied, regarding the accuracy, completeness, or suitability of any content or products presented. Nothing on this website should be construed as legal, tax, investment, financial, medical, or other professional advice. In addition, no part of this site—including articles or product references—constitutes a solicitation, recommendation, endorsement, advertisement, or offer to buy or sell any securities, franchises, or other financial instruments, particularly in jurisdictions where such activity would be unlawful.
All content is of a general nature and may not address the specific circumstances of any individual or entity. It is not a substitute for professional advice or services. Any actions you take based on the information provided here are strictly at your own risk. You accept full responsibility for any decisions or outcomes arising from your use of this website and agree to release us from any liability in connection with your use of, or reliance upon, the content or products found herein.