
|
CK Hutchison Holdings Limited (0001.HK) DCF -Bewertung |
Fully Editable: Tailor To Your Needs In Excel Or Sheets
Professional Design: Trusted, Industry-Standard Templates
Investor-Approved Valuation Models
MAC/PC Compatible, Fully Unlocked
No Expertise Is Needed; Easy To Follow
CK Hutchison Holdings Limited (0001.HK) Bundle
Verbessern Sie Ihre Anlagestrategien mit dem DCF -Taschenrechner des CK Hutchison Holdings Limited (0001HK)! Verwenden Sie echte CK -Hutchison -Finanzdaten, passen Sie Wachstumsprojektionen und -kosten an und beobachten Sie sofort, wie sich diese Veränderungen auf den inneren Wert von CK Hutchison Holdings Limited (0001HK) auswirken.
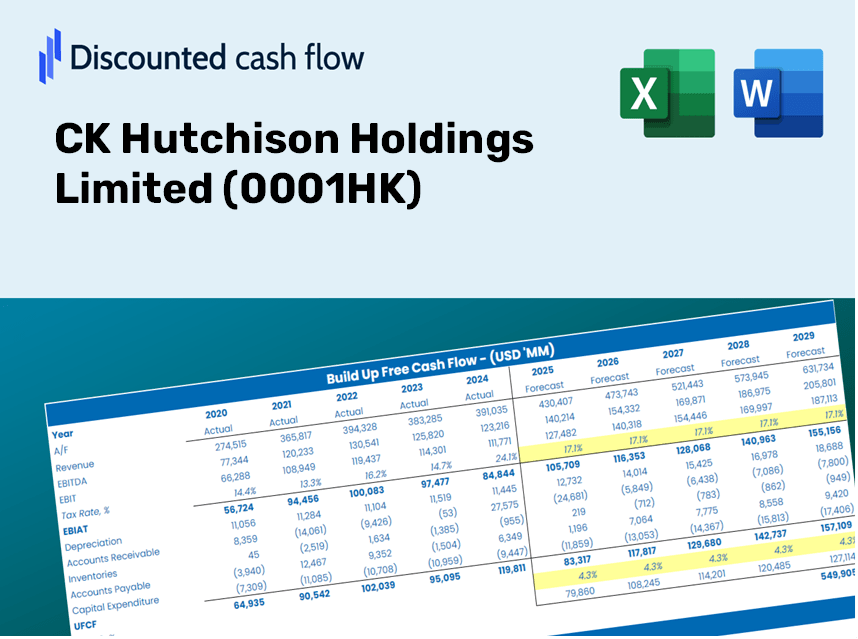
Discounted Cash Flow (DCF) - (USD MM)
| Year | AY1 2020 |
AY2 2021 |
AY3 2022 |
AY4 2023 |
AY5 2024 |
FY1 2025 |
FY2 2026 |
FY3 2027 |
FY4 2028 |
FY5 2029 |
|---|---|---|---|---|---|---|---|---|---|---|
| Revenue | 266,396.0 | 280,847.0 | 262,497.0 | 275,575.0 | 281,351.0 | 285,549.4 | 289,810.5 | 294,135.2 | 298,524.4 | 302,979.1 |
| Revenue Growth, % | 0 | 5.42 | -6.53 | 4.98 | 2.1 | 1.49 | 1.49 | 1.49 | 1.49 | 1.49 |
| EBITDA | 76,809.0 | 77,936.0 | 65,425.0 | 85,144.0 | 48,577.0 | 74,054.1 | 75,159.2 | 76,280.8 | 77,419.0 | 78,574.3 |
| EBITDA, % | 28.83 | 27.75 | 24.92 | 30.9 | 17.27 | 25.93 | 25.93 | 25.93 | 25.93 | 25.93 |
| Depreciation | 41,658.0 | 45,256.0 | 39,788.0 | 40,083.0 | 21,926.0 | 39,547.2 | 40,137.4 | 40,736.3 | 41,344.2 | 41,961.1 |
| Depreciation, % | 15.64 | 16.11 | 15.16 | 14.55 | 7.79 | 13.85 | 13.85 | 13.85 | 13.85 | 13.85 |
| EBIT | 35,151.0 | 32,680.0 | 25,637.0 | 45,061.0 | 26,651.0 | 34,506.9 | 35,021.8 | 35,544.5 | 36,074.9 | 36,613.2 |
| EBIT, % | 13.2 | 11.64 | 9.77 | 16.35 | 9.47 | 12.08 | 12.08 | 12.08 | 12.08 | 12.08 |
| Total Cash | 155,951.0 | 153,133.0 | 138,085.0 | 127,323.0 | 121,310.0 | 145,624.8 | 147,797.9 | 150,003.4 | 152,241.8 | 154,513.6 |
| Total Cash, percent | .0 | .0 | .0 | .0 | .0 | .0 | .0 | .0 | .0 | .0 |
| Account Receivables | 36,732.0 | 36,766.0 | 32,725.0 | 20,051.0 | 31,517.0 | 33,023.5 | 33,516.3 | 34,016.4 | 34,524.0 | 35,039.2 |
| Account Receivables, % | 13.79 | 13.09 | 12.47 | 7.28 | 11.2 | 11.56 | 11.56 | 11.56 | 11.56 | 11.56 |
| Inventories | 24,565.0 | 23,625.0 | 23,283.0 | 24,473.0 | 24,923.0 | 25,266.6 | 25,643.7 | 26,026.3 | 26,414.7 | 26,808.9 |
| Inventories, % | 9.22 | 8.41 | 8.87 | 8.88 | 8.86 | 8.85 | 8.85 | 8.85 | 8.85 | 8.85 |
| Accounts Payable | 25,042.0 | 23,382.0 | 21,356.0 | 23,017.0 | 21,861.0 | 23,977.0 | 24,334.7 | 24,697.9 | 25,066.4 | 25,440.5 |
| Accounts Payable, % | 9.4 | 8.33 | 8.14 | 8.35 | 7.77 | 8.4 | 8.4 | 8.4 | 8.4 | 8.4 |
| Capital Expenditure | -29,574.0 | -39,643.0 | -25,852.0 | -25,301.0 | -20,365.0 | -29,403.0 | -29,841.8 | -30,287.1 | -30,739.0 | -31,197.7 |
| Capital Expenditure, % | -11.1 | -14.12 | -9.85 | -9.18 | -7.24 | -10.3 | -10.3 | -10.3 | -10.3 | -10.3 |
| Tax Rate, % | 40.19 | 40.19 | 40.19 | 40.19 | 40.19 | 40.19 | 40.19 | 40.19 | 40.19 | 40.19 |
| EBITAT | 24,566.7 | 25,625.4 | 18,107.3 | 31,884.1 | 15,940.2 | 24,120.3 | 24,480.3 | 24,845.6 | 25,216.3 | 25,592.6 |
| Depreciation | ||||||||||
| Changes in Account Receivables | ||||||||||
| Changes in Inventories | ||||||||||
| Changes in Accounts Payable | ||||||||||
| Capital Expenditure | ||||||||||
| UFCF | 395.7 | 30,484.4 | 34,400.3 | 59,811.1 | 4,429.2 | 34,530.4 | 34,263.8 | 34,775.1 | 35,294.0 | 35,820.7 |
| WACC, % | 4.49 | 4.71 | 4.51 | 4.51 | 4.23 | 4.49 | 4.49 | 4.49 | 4.49 | 4.49 |
| PV UFCF | ||||||||||
| SUM PV UFCF | 153,273.2 | |||||||||
| Long Term Growth Rate, % | 2.00 | |||||||||
| Free cash flow (T + 1) | 36,537 | |||||||||
| Terminal Value | 1,466,871 | |||||||||
| Present Terminal Value | 1,177,609 | |||||||||
| Enterprise Value | 1,330,882 | |||||||||
| Net Debt | 203,428 | |||||||||
| Equity Value | 1,127,454 | |||||||||
| Diluted Shares Outstanding, MM | 3,830 | |||||||||
| Equity Value Per Share | 294.37 |
What You Will Gain
- Authentic CK Hutchison Data: Preloaded financial metrics – from revenue to EBIT – sourced from actual and forecasted figures.
- Comprehensive Customization: Modify all key parameters (yellow cells) such as WACC, growth %, and tax rates.
- Immediate Valuation Updates: Automatic recalculations to assess the impact of changes on CK Hutchison's fair value.
- Flexible Excel Template: Designed for swift modifications, scenario analysis, and in-depth projections.
- Efficient and Precise: Avoid building models from the ground up while ensuring accuracy and adaptability.
Key Features
- Real-Life CK Hutchison Data: Pre-loaded with CK Hutchison Holdings Limited's historical financial performance and future projections.
- Fully Customizable Inputs: Modify revenue growth, profit margins, WACC, tax rates, and capital expenditures to fit your analysis.
- Dynamic Valuation Model: Automatically updates Net Present Value (NPV) and intrinsic value in response to your customized parameters.
- Scenario Testing: Generate various forecasting scenarios to evaluate different valuation results.
- User-Friendly Design: Intuitive, organized layout suitable for both professionals and novices.
How It Works
- Step 1: Download the prebuilt Excel template featuring CK Hutchison Holdings Limited’s data.
- Step 2: Review the pre-filled sheets to gain insights into the key performance indicators.
- Step 3: Modify forecasts and assumptions in the editable yellow cells (WACC, growth, margins).
- Step 4: Immediately see the recalculated outcomes, including the intrinsic value of CK Hutchison Holdings Limited.
- Step 5: Make educated investment choices or create reports based on the generated outputs.
Why Choose This Calculator?
- Designed for Experts: A sophisticated tool utilized by analysts, CFOs, and consultants.
- Accurate Financial Data: CK Hutchison Holdings Limited's historical and projected financials are preloaded for precision.
- Versatile Scenario Analysis: Effortlessly simulate various forecasts and assumptions.
- Comprehensive Outputs: Automatically calculates intrinsic value, NPV, and essential metrics.
- User-Friendly: Step-by-step guidance makes the process seamless.
Who Should Use This Product?
- Investors: Accurately assess the fair value of CK Hutchison Holdings Limited (0001HK) before making investment choices.
- CFOs: Utilize a professional-grade DCF model for comprehensive financial reporting and analysis.
- Consultants: Efficiently modify the template for valuation reports tailored to client needs.
- Entrepreneurs: Discover insights into the financial modeling techniques employed by major corporations.
- Educators: Leverage this resource as a teaching aid to illustrate various valuation methodologies.
Contents of the Template
- Historical Data: Features CK Hutchison Holdings Limited's past financials and foundational forecasts.
- DCF and Levered DCF Models: Comprehensive templates to assess the intrinsic value of CK Hutchison Holdings Limited.
- WACC Sheet: Pre-configured calculations for the Weighted Average Cost of Capital.
- Editable Inputs: Adjust essential drivers such as growth rates, EBITDA %, and CAPEX assumptions.
- Quarterly and Annual Statements: An extensive analysis of CK Hutchison Holdings Limited's financial performance.
- Interactive Dashboard: Dynamically visualize valuation results and future projections.
Disclaimer
All information, articles, and product details provided on this website are for general informational and educational purposes only. We do not claim any ownership over, nor do we intend to infringe upon, any trademarks, copyrights, logos, brand names, or other intellectual property mentioned or depicted on this site. Such intellectual property remains the property of its respective owners, and any references here are made solely for identification or informational purposes, without implying any affiliation, endorsement, or partnership.
We make no representations or warranties, express or implied, regarding the accuracy, completeness, or suitability of any content or products presented. Nothing on this website should be construed as legal, tax, investment, financial, medical, or other professional advice. In addition, no part of this site—including articles or product references—constitutes a solicitation, recommendation, endorsement, advertisement, or offer to buy or sell any securities, franchises, or other financial instruments, particularly in jurisdictions where such activity would be unlawful.
All content is of a general nature and may not address the specific circumstances of any individual or entity. It is not a substitute for professional advice or services. Any actions you take based on the information provided here are strictly at your own risk. You accept full responsibility for any decisions or outcomes arising from your use of this website and agree to release us from any liability in connection with your use of, or reliance upon, the content or products found herein.