
|
Guangzhou Hengyun Enterprises Holding Ltd (000531.sz) DCF -Bewertung |
Fully Editable: Tailor To Your Needs In Excel Or Sheets
Professional Design: Trusted, Industry-Standard Templates
Investor-Approved Valuation Models
MAC/PC Compatible, Fully Unlocked
No Expertise Is Needed; Easy To Follow
Guangzhou Hengyun Enterprises Holding Ltd (000531.SZ) Bundle
Vereinfachen Sie die Bewertung von Guangzhou Hengyun Enterprises Holding Ltd (000531SZ) mit diesem anpassbaren DCF -Taschenrechner! Mit echten Guangzhou Hengyun Enterprises Holding Ltd (000531SZ) Finanzdaten und einstellbaren Prognoseeingaben können Sie Szenarien testen und Guangzhou Hengyun Enterprises Holding Ltd (000531SZ) in Minuten fairen Wert aufdecken.
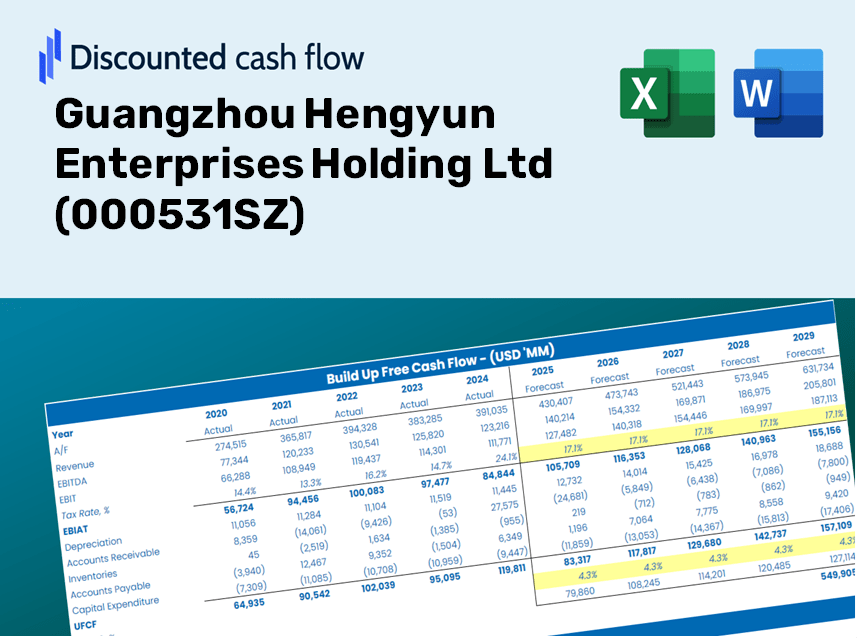
Discounted Cash Flow (DCF) - (USD MM)
| Year | AY1 2020 |
AY2 2021 |
AY3 2022 |
AY4 2023 |
AY5 2024 |
FY1 2025 |
FY2 2026 |
FY3 2027 |
FY4 2028 |
FY5 2029 |
|---|---|---|---|---|---|---|---|---|---|---|
| Revenue | 3,462.0 | 3,928.2 | 3,932.2 | 4,822.2 | 4,298.8 | 4,058.3 | 3,831.2 | 3,616.9 | 3,414.5 | 3,223.5 |
| Revenue Growth, % | 0 | 13.47 | 0.10152 | 22.64 | -10.86 | -5.59 | -5.59 | -5.59 | -5.59 | -5.59 |
| EBITDA | 1,038.4 | 406.6 | 164.5 | 1,028.9 | 603.5 | 648.6 | 612.3 | 578.0 | 545.7 | 515.1 |
| EBITDA, % | 30 | 10.35 | 4.18 | 21.34 | 14.04 | 15.98 | 15.98 | 15.98 | 15.98 | 15.98 |
| Depreciation | 394.5 | 336.8 | 425.2 | 417.3 | 376.2 | 391.1 | 369.2 | 348.6 | 329.1 | 310.7 |
| Depreciation, % | 11.4 | 8.58 | 10.81 | 8.65 | 8.75 | 9.64 | 9.64 | 9.64 | 9.64 | 9.64 |
| EBIT | 643.9 | 69.8 | -260.8 | 611.6 | 227.3 | 257.4 | 243.0 | 229.4 | 216.6 | 204.5 |
| EBIT, % | 18.6 | 1.78 | -6.63 | 12.68 | 5.29 | 6.34 | 6.34 | 6.34 | 6.34 | 6.34 |
| Total Cash | 2,903.6 | 2,885.1 | 799.2 | 2,562.8 | 1,090.3 | 2,079.0 | 1,962.7 | 1,852.9 | 1,749.2 | 1,651.4 |
| Total Cash, percent | .0 | .0 | .0 | .0 | .0 | .0 | .0 | .0 | .0 | .0 |
| Account Receivables | 408.5 | 496.2 | 517.9 | 568.3 | 493.8 | 494.1 | 466.5 | 440.4 | 415.7 | 392.5 |
| Account Receivables, % | 11.8 | 12.63 | 13.17 | 11.78 | 11.49 | 12.18 | 12.18 | 12.18 | 12.18 | 12.18 |
| Inventories | 715.4 | 968.6 | 215.6 | 229.7 | 160.5 | 481.3 | 454.4 | 429.0 | 405.0 | 382.3 |
| Inventories, % | 20.66 | 24.66 | 5.48 | 4.76 | 3.73 | 11.86 | 11.86 | 11.86 | 11.86 | 11.86 |
| Accounts Payable | 415.8 | 596.7 | 578.8 | 1,203.0 | 1,119.2 | 754.1 | 711.9 | 672.0 | 634.4 | 598.9 |
| Accounts Payable, % | 12.01 | 15.19 | 14.72 | 24.95 | 26.04 | 18.58 | 18.58 | 18.58 | 18.58 | 18.58 |
| Capital Expenditure | -973.8 | -1,025.0 | -1,949.2 | -2,206.1 | -1,232.7 | -1,446.5 | -1,365.6 | -1,289.2 | -1,217.1 | -1,149.0 |
| Capital Expenditure, % | -28.13 | -26.09 | -49.57 | -45.75 | -28.68 | -35.64 | -35.64 | -35.64 | -35.64 | -35.64 |
| Tax Rate, % | 10.51 | 10.51 | 10.51 | 10.51 | 10.51 | 10.51 | 10.51 | 10.51 | 10.51 | 10.51 |
| EBITAT | 504.8 | 84.0 | -28.9 | 557.6 | 203.4 | 190.6 | 179.9 | 169.8 | 160.3 | 151.4 |
| Depreciation | ||||||||||
| Changes in Account Receivables | ||||||||||
| Changes in Inventories | ||||||||||
| Changes in Accounts Payable | ||||||||||
| Capital Expenditure | ||||||||||
| UFCF | -782.7 | -764.1 | -839.5 | -671.4 | -593.2 | -1,551.1 | -804.0 | -759.1 | -716.6 | -676.5 |
| WACC, % | 3.86 | 4.3 | 2.47 | 4.12 | 4.09 | 3.77 | 3.77 | 3.77 | 3.77 | 3.77 |
| PV UFCF | ||||||||||
| SUM PV UFCF | -4,101.3 | |||||||||
| Long Term Growth Rate, % | 4.00 | |||||||||
| Free cash flow (T + 1) | -704 | |||||||||
| Terminal Value | 302,396 | |||||||||
| Present Terminal Value | 251,347 | |||||||||
| Enterprise Value | 247,246 | |||||||||
| Net Debt | 6,625 | |||||||||
| Equity Value | 240,620 | |||||||||
| Diluted Shares Outstanding, MM | 1,041 | |||||||||
| Equity Value Per Share | 231.05 |
What You Will Receive
- Genuine Guangzhou Hengyun Data: Preloaded financial metrics – from revenue to EBIT – based on real and forecasted figures.
- Comprehensive Customization: Modify all essential parameters (yellow cells) such as WACC, growth %, and tax rates.
- Immediate Valuation Updates: Automatic recalculations to assess the effects of changes on Guangzhou Hengyun’s fair value.
- Flexible Excel Template: Designed for quick adjustments, scenario analysis, and thorough projections.
- Efficient and Precise: Eliminate the need to build models from scratch while ensuring accuracy and adaptability.
Key Features
- Real-Life GH Enterprises Data: Pre-filled with Guangzhou Hengyun Enterprises Holding Ltd’s historical financials and projected forecasts.
- Fully Customizable Inputs: Modify revenue growth rates, profit margins, WACC, tax rates, and capital expenditures as needed.
- Dynamic Valuation Model: Automatically updates the Net Present Value (NPV) and intrinsic value based on your custom inputs.
- Scenario Testing: Develop various forecast scenarios to explore different valuation results.
- User-Friendly Design: Intuitive, well-organized, and suitable for both experienced professionals and newcomers.
How It Functions
- Step 1: Download the Excel file.
- Step 2: Explore the pre-filled financial data and forecasts for Guangzhou Hengyun Enterprises Holding Ltd (000531SZ).
- Step 3: Adjust key inputs such as revenue growth, WACC, and tax rates (highlighted cells).
- Step 4: Observe the DCF model update in real-time as you modify the assumptions.
- Step 5: Evaluate the outputs and utilize the findings for your investment strategies.
Why Choose This Calculator for Guangzhou Hengyun Enterprises Holding Ltd (000531SZ)?
- Precision: Utilizes genuine financial data from Guangzhou Hengyun to ensure accurate results.
- Adaptability: Built to allow users to seamlessly test and adjust inputs as needed.
- Efficiency: Eliminate the complexities of constructing a DCF model from the ground up.
- High Professional Standards: Crafted with the precision and usability expected at the CFO level.
- Intuitive Design: Simple to navigate, suitable for users with no extensive financial modeling background.
Who Should Benefit from This Product?
- Institutional Investors: Develop comprehensive and trustworthy valuation models for portfolio assessments related to Guangzhou Hengyun Enterprises Holding Ltd (000531SZ).
- Corporate Finance Departments: Evaluate valuation scenarios to inform strategic decisions within the company.
- Financial Consultants: Deliver precise valuation analyses to clients focused on Guangzhou Hengyun Enterprises Holding Ltd (000531SZ).
- Students and Instructors: Utilize real data to enhance learning and practice in financial modeling.
- Market Analysts: Gain insights into how companies like Guangzhou Hengyun Enterprises Holding Ltd (000531SZ) are valued in the market.
Contents of the Template
- Preloaded GHEH Data: Historical and projected financial metrics, including revenue, EBIT, and capital expenditures.
- DCF and WACC Models: Advanced spreadsheets designed for calculating intrinsic value and Weighted Average Cost of Capital.
- Editable Inputs: Cells highlighted in yellow for easy modification of revenue growth, tax rates, and discount rates.
- Financial Statements: Detailed annual and quarterly financial reports for in-depth analysis.
- Key Ratios: Ratios measuring profitability, leverage, and efficiency for performance assessment.
- Dashboard and Charts: Visual representations of valuation results and underlying assumptions.
Disclaimer
All information, articles, and product details provided on this website are for general informational and educational purposes only. We do not claim any ownership over, nor do we intend to infringe upon, any trademarks, copyrights, logos, brand names, or other intellectual property mentioned or depicted on this site. Such intellectual property remains the property of its respective owners, and any references here are made solely for identification or informational purposes, without implying any affiliation, endorsement, or partnership.
We make no representations or warranties, express or implied, regarding the accuracy, completeness, or suitability of any content or products presented. Nothing on this website should be construed as legal, tax, investment, financial, medical, or other professional advice. In addition, no part of this site—including articles or product references—constitutes a solicitation, recommendation, endorsement, advertisement, or offer to buy or sell any securities, franchises, or other financial instruments, particularly in jurisdictions where such activity would be unlawful.
All content is of a general nature and may not address the specific circumstances of any individual or entity. It is not a substitute for professional advice or services. Any actions you take based on the information provided here are strictly at your own risk. You accept full responsibility for any decisions or outcomes arising from your use of this website and agree to release us from any liability in connection with your use of, or reliance upon, the content or products found herein.