
|
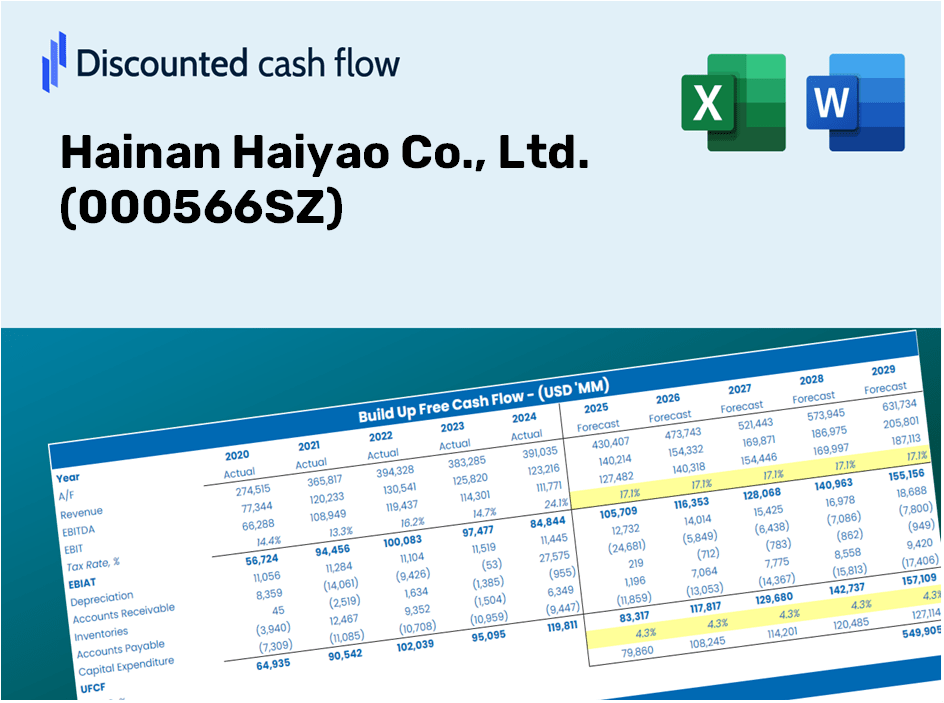
Hainan Haiyao Co., Ltd. (000566.sz) DCF -Bewertung |
Fully Editable: Tailor To Your Needs In Excel Or Sheets
Professional Design: Trusted, Industry-Standard Templates
Investor-Approved Valuation Models
MAC/PC Compatible, Fully Unlocked
No Expertise Is Needed; Easy To Follow
Hainan Haiyao Co., Ltd. (000566.SZ) Bundle
Egal, ob Sie ein Investor oder Analyst sind, dieser DCF -Taschenrechner (000566SZ) ist Ihr ultimatives Werkzeug für eine genaue Bewertung. Mit echten Daten von Hainan Haiyao Co., Ltd., können Sie Prognosen anpassen und die Effekte in Echtzeit beobachten.
Discounted Cash Flow (DCF) - (USD MM)
| Year | AY1 2020 |
AY2 2021 |
AY3 2022 |
AY4 2023 |
AY5 2024 |
FY1 2025 |
FY2 2026 |
FY3 2027 |
FY4 2028 |
FY5 2029 |
|---|---|---|---|---|---|---|---|---|---|---|
| Revenue | 2,200.3 | 2,059.1 | 1,779.1 | 1,478.6 | 990.7 | 1,155.0 | 1,346.4 | 1,569.7 | 1,829.9 | 2,133.3 |
| Revenue Growth, % | 0 | -6.42 | -13.6 | -16.89 | -33 | 16.58 | 16.58 | 16.58 | 16.58 | 16.58 |
| EBITDA | -336.5 | -521.0 | 25.0 | 158.2 | -441.5 | -168.8 | -196.8 | -229.4 | -267.4 | -311.8 |
| EBITDA, % | -15.3 | -25.3 | 1.4 | 10.7 | -44.57 | -14.61 | -14.61 | -14.61 | -14.61 | -14.61 |
| Depreciation | 304.8 | 176.3 | 152.8 | 157.5 | 177.6 | 137.6 | 160.4 | 187.0 | 218.0 | 254.2 |
| Depreciation, % | 13.85 | 8.56 | 8.59 | 10.65 | 17.93 | 11.92 | 11.92 | 11.92 | 11.92 | 11.92 |
| EBIT | -641.3 | -697.3 | -127.8 | .7 | -619.1 | -306.4 | -357.2 | -416.4 | -485.5 | -565.9 |
| EBIT, % | -29.15 | -33.86 | -7.18 | 0.04464687 | -62.49 | -26.53 | -26.53 | -26.53 | -26.53 | -26.53 |
| Total Cash | 2,946.7 | 1,596.8 | 974.5 | 933.0 | 521.7 | 804.0 | 937.4 | 1,092.8 | 1,273.9 | 1,485.1 |
| Total Cash, percent | .0 | .0 | .0 | .0 | .0 | .0 | .0 | .0 | .0 | .0 |
| Account Receivables | 734.8 | 565.4 | 382.6 | 1,221.6 | 467.9 | 490.2 | 571.4 | 666.2 | 776.6 | 905.4 |
| Account Receivables, % | 33.39 | 27.46 | 21.51 | 82.62 | 47.23 | 42.44 | 42.44 | 42.44 | 42.44 | 42.44 |
| Inventories | 300.9 | 260.1 | 277.1 | 320.9 | 375.4 | 234.4 | 273.3 | 318.6 | 371.4 | 433.0 |
| Inventories, % | 13.68 | 12.63 | 15.57 | 21.7 | 37.9 | 20.3 | 20.3 | 20.3 | 20.3 | 20.3 |
| Accounts Payable | 1,331.6 | 932.3 | 523.7 | 473.3 | 500.4 | 503.0 | 586.4 | 683.6 | 796.9 | 929.0 |
| Accounts Payable, % | 60.52 | 45.28 | 29.44 | 32.01 | 50.51 | 43.55 | 43.55 | 43.55 | 43.55 | 43.55 |
| Capital Expenditure | -768.9 | -415.1 | -263.8 | -210.7 | -175.6 | -235.4 | -274.4 | -319.9 | -372.9 | -434.8 |
| Capital Expenditure, % | -34.94 | -20.16 | -14.83 | -14.25 | -17.72 | -20.38 | -20.38 | -20.38 | -20.38 | -20.38 |
| Tax Rate, % | 2.3 | 2.3 | 2.3 | 2.3 | 2.3 | 2.3 | 2.3 | 2.3 | 2.3 | 2.3 |
| EBITAT | -522.5 | -697.1 | 22.8 | .6 | -604.9 | -226.1 | -263.6 | -307.3 | -358.2 | -417.6 |
| Depreciation | ||||||||||
| Changes in Account Receivables | ||||||||||
| Changes in Inventories | ||||||||||
| Changes in Accounts Payable | ||||||||||
| Capital Expenditure | ||||||||||
| UFCF | -690.8 | -1,124.9 | -331.0 | -985.7 | 123.3 | -202.5 | -414.3 | -483.0 | -563.0 | -656.4 |
| WACC, % | 9.39 | 9.7 | 8.01 | 9.53 | 9.66 | 9.26 | 9.26 | 9.26 | 9.26 | 9.26 |
| PV UFCF | ||||||||||
| SUM PV UFCF | -1,719.5 | |||||||||
| Long Term Growth Rate, % | 3.00 | |||||||||
| Free cash flow (T + 1) | -676 | |||||||||
| Terminal Value | -10,804 | |||||||||
| Present Terminal Value | -6,939 | |||||||||
| Enterprise Value | -8,659 | |||||||||
| Net Debt | 2,197 | |||||||||
| Equity Value | -10,856 | |||||||||
| Diluted Shares Outstanding, MM | 1,297 | |||||||||
| Equity Value Per Share | -8.37 |
Benefits You Will Receive
- Authentic Hainan Haiyao Data: Comprehensive financials – including revenue and EBIT – derived from actual and forecasted data.
- Complete Customization: Modify essential parameters (yellow cells) such as WACC, growth percentage, and tax rates at your convenience.
- Immediate Valuation Adjustments: Automatic recalculations that allow you to assess the effects of changes on Hainan Haiyao’s fair value.
- Flexible Excel Template: Designed for easy modifications, scenario analysis, and in-depth projections.
- Efficient and Precise: Eliminate the hassle of constructing models from the ground up while ensuring accuracy and adaptability.
Key Features
- Customizable Forecast Inputs: Adjust essential factors such as revenue growth, EBITDA margin, and capital expenditures with ease.
- Instant DCF Valuation: Automatically computes intrinsic value, NPV, and other key metrics in real-time.
- High-Precision Analytics: Leverages Hainan Haiyao Co., Ltd.'s (000566SZ) actual financial data for accurate valuation results.
- Simplified Scenario Analysis: Effortlessly evaluate various assumptions and analyze their impacts side by side.
- Efficiency Booster: Remove the hassle of creating intricate valuation models from the ground up.
Process Overview
- 1. Access the Template: Download and open the Excel file containing Hainan Haiyao Co., Ltd.’s preloaded data.
- 2. Update Key Assumptions: Modify essential inputs such as growth rates, WACC, and capital expenditures.
- 3. View Instant Results: The DCF model automatically calculates intrinsic value and NPV in real-time.
- 4. Explore Various Scenarios: Evaluate multiple forecasts to assess different valuation possibilities.
- 5. Present with Assurance: Deliver professional valuation insights to bolster your decision-making process.
Why Opt for This Calculator?
- Reliable Information: Genuine Hainan Haiyao Co., Ltd. financials guarantee trustworthy valuation outcomes.
- Customizable: Modify essential factors such as growth rates, WACC, and tax rates to align with your forecasts.
- Time-Efficient: Pre-configured calculations remove the hassle of starting from zero.
- Professional Tool: Crafted for investors, analysts, and consultants alike.
- User-Friendly: An intuitive design and clear step-by-step guidance make it accessible for everyone.
Who Can Benefit from This Product?
- Pharmaceutical Students: Master drug evaluation techniques and apply them to current market data.
- Researchers: Utilize advanced models in your academic studies or medical research.
- Investors: Validate your investment hypotheses and analyze valuation trends for Hainan Haiyao Co., Ltd. (000566SZ).
- Market Analysts: Enhance your efficiency with a pre-structured, adaptable DCF model tailored for pharmaceuticals.
- Entrepreneurs: Understand how major public pharmaceuticals like Hainan Haiyao are assessed in the market.
Contents of the Template
- Pre-Filled DCF Model: Hainan Haiyao Co., Ltd.'s financial data preloaded for immediate analysis.
- WACC Calculator: Comprehensive calculations for Weighted Average Cost of Capital.
- Financial Ratios: Assess Hainan Haiyao's profitability, leverage, and operational efficiency.
- Editable Inputs: Adjust assumptions like growth, margins, and CAPEX to suit your analysis needs.
- Financial Statements: Annual and quarterly reports for in-depth financial assessment.
- Interactive Dashboard: Visualize key valuation metrics and outcomes with ease.
Disclaimer
All information, articles, and product details provided on this website are for general informational and educational purposes only. We do not claim any ownership over, nor do we intend to infringe upon, any trademarks, copyrights, logos, brand names, or other intellectual property mentioned or depicted on this site. Such intellectual property remains the property of its respective owners, and any references here are made solely for identification or informational purposes, without implying any affiliation, endorsement, or partnership.
We make no representations or warranties, express or implied, regarding the accuracy, completeness, or suitability of any content or products presented. Nothing on this website should be construed as legal, tax, investment, financial, medical, or other professional advice. In addition, no part of this site—including articles or product references—constitutes a solicitation, recommendation, endorsement, advertisement, or offer to buy or sell any securities, franchises, or other financial instruments, particularly in jurisdictions where such activity would be unlawful.
All content is of a general nature and may not address the specific circumstances of any individual or entity. It is not a substitute for professional advice or services. Any actions you take based on the information provided here are strictly at your own risk. You accept full responsibility for any decisions or outcomes arising from your use of this website and agree to release us from any liability in connection with your use of, or reliance upon, the content or products found herein.