
|
Northeast Pharmaceutical Group Co., Ltd. (000597.SZ) DCF -Bewertung |
Fully Editable: Tailor To Your Needs In Excel Or Sheets
Professional Design: Trusted, Industry-Standard Templates
Investor-Approved Valuation Models
MAC/PC Compatible, Fully Unlocked
No Expertise Is Needed; Easy To Follow
Northeast Pharmaceutical Group Co., Ltd. (000597.SZ) Bundle
Entdecken Sie die finanzielle Zukunft der Northeast Pharmaceutical Group Co., Ltd. (000597SZ) mit unserem benutzerfreundlichen DCF-Taschenrechner! Geben Sie Ihre Projektionen für Wachstum, Margen und Kosten ein, um den inneren Wert der Northeast Pharmaceutical Group Co., Ltd. (000597SZ) zu berechnen, und verbessern Sie Ihre Anlagestrategie.
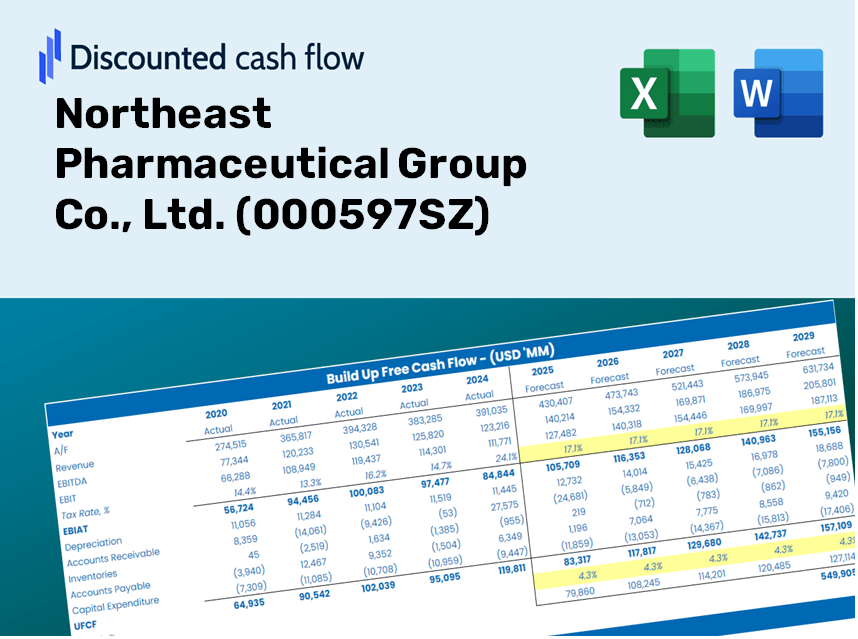
Discounted Cash Flow (DCF) - (USD MM)
| Year | AY1 2020 |
AY2 2021 |
AY3 2022 |
AY4 2023 |
AY5 2024 |
FY1 2025 |
FY2 2026 |
FY3 2027 |
FY4 2028 |
FY5 2029 |
|---|---|---|---|---|---|---|---|---|---|---|
| Revenue | 7,384.4 | 8,145.1 | 8,808.9 | 8,243.2 | 7,502.6 | 7,559.7 | 7,617.2 | 7,675.2 | 7,733.6 | 7,792.5 |
| Revenue Growth, % | 0 | 10.3 | 8.15 | -6.42 | -8.98 | 0.76126 | 0.76126 | 0.76126 | 0.76126 | 0.76126 |
| EBITDA | 694.3 | 722.5 | 754.4 | 911.4 | 1,018.7 | 778.2 | 784.1 | 790.1 | 796.1 | 802.2 |
| EBITDA, % | 9.4 | 8.87 | 8.56 | 11.06 | 13.58 | 10.29 | 10.29 | 10.29 | 10.29 | 10.29 |
| Depreciation | 480.8 | 511.8 | 534.8 | 545.2 | 542.7 | 494.6 | 498.4 | 502.2 | 506.0 | 509.8 |
| Depreciation, % | 6.51 | 6.28 | 6.07 | 6.61 | 7.23 | 6.54 | 6.54 | 6.54 | 6.54 | 6.54 |
| EBIT | 213.5 | 210.6 | 219.6 | 366.2 | 476.0 | 283.6 | 285.7 | 287.9 | 290.1 | 292.3 |
| EBIT, % | 2.89 | 2.59 | 2.49 | 4.44 | 6.34 | 3.75 | 3.75 | 3.75 | 3.75 | 3.75 |
| Total Cash | 1,481.3 | 2,550.4 | 3,844.9 | 5,651.2 | 4,468.3 | 3,373.6 | 3,399.3 | 3,425.2 | 3,451.3 | 3,477.5 |
| Total Cash, percent | .0 | .0 | .0 | .0 | .0 | .0 | .0 | .0 | .0 | .0 |
| Account Receivables | 2,240.3 | 2,376.3 | 2,539.0 | 2,404.3 | 2,687.0 | 2,318.0 | 2,335.7 | 2,353.5 | 2,371.4 | 2,389.4 |
| Account Receivables, % | 30.34 | 29.17 | 28.82 | 29.17 | 35.81 | 30.66 | 30.66 | 30.66 | 30.66 | 30.66 |
| Inventories | 1,253.2 | 1,247.3 | 1,220.4 | 1,364.1 | 1,323.8 | 1,214.6 | 1,223.8 | 1,233.1 | 1,242.5 | 1,252.0 |
| Inventories, % | 16.97 | 15.31 | 13.85 | 16.55 | 17.65 | 16.07 | 16.07 | 16.07 | 16.07 | 16.07 |
| Accounts Payable | 2,763.9 | 3,695.8 | 4,320.5 | 5,777.6 | 4,840.5 | 4,028.7 | 4,059.4 | 4,090.3 | 4,121.4 | 4,152.8 |
| Accounts Payable, % | 37.43 | 45.37 | 49.05 | 70.09 | 64.52 | 53.29 | 53.29 | 53.29 | 53.29 | 53.29 |
| Capital Expenditure | -400.4 | -119.8 | -244.1 | -235.4 | -159.4 | -221.4 | -223.1 | -224.8 | -226.5 | -228.2 |
| Capital Expenditure, % | -5.42 | -1.47 | -2.77 | -2.86 | -2.12 | -2.93 | -2.93 | -2.93 | -2.93 | -2.93 |
| Tax Rate, % | 30.99 | 30.99 | 30.99 | 30.99 | 30.99 | 30.99 | 30.99 | 30.99 | 30.99 | 30.99 |
| EBITAT | 28.5 | 173.6 | 146.4 | 268.9 | 328.4 | 172.9 | 174.2 | 175.5 | 176.9 | 178.2 |
| Depreciation | ||||||||||
| Changes in Account Receivables | ||||||||||
| Changes in Inventories | ||||||||||
| Changes in Accounts Payable | ||||||||||
| Capital Expenditure | ||||||||||
| UFCF | -620.7 | 1,367.4 | 925.8 | 2,026.9 | -467.8 | 112.4 | 453.2 | 456.7 | 460.2 | 463.7 |
| WACC, % | 3.95 | 4.76 | 4.57 | 4.65 | 4.6 | 4.51 | 4.51 | 4.51 | 4.51 | 4.51 |
| PV UFCF | ||||||||||
| SUM PV UFCF | 1,680.5 | |||||||||
| Long Term Growth Rate, % | 2.00 | |||||||||
| Free cash flow (T + 1) | 473 | |||||||||
| Terminal Value | 18,876 | |||||||||
| Present Terminal Value | 15,143 | |||||||||
| Enterprise Value | 16,823 | |||||||||
| Net Debt | -2,896 | |||||||||
| Equity Value | 19,719 | |||||||||
| Diluted Shares Outstanding, MM | 1,429 | |||||||||
| Equity Value Per Share | 13.80 |
What You Will Receive
- Authentic Northeast Pharmaceutical Data: Comprehensive financials – from revenue to EBIT – derived from both actual and projected figures.
- Complete Customization: Modify all key parameters (highlighted in yellow) such as WACC, growth %, and tax rates to fit your analyses.
- Instant Valuation Updates: Automatic recalculations that allow you to assess the effects of various changes on the fair value of Northeast Pharmaceutical Group (000597SZ).
- Flexible Excel Template: Designed for easy modifications, scenario testing, and detailed forecasting.
- Efficient and Precise: Eliminate the need to build models from the ground up while ensuring both accuracy and adaptability.
Key Features
- Comprehensive DCF Calculator: Offers detailed unlevered and levered DCF valuation models tailored for Northeast Pharmaceutical Group Co., Ltd. (000597SZ).
- WACC Calculator: Features a pre-built Weighted Average Cost of Capital sheet with customizable inputs for precise analysis.
- Customizable Forecast Assumptions: Easily adjust growth rates, capital expenditures, and discount rates to fit your projections.
- Integrated Financial Ratios: Evaluate profitability, leverage, and efficiency ratios specifically for Northeast Pharmaceutical Group Co., Ltd. (000597SZ).
- Visual Dashboard and Charts: Presents visual summaries of key valuation metrics for quick and easy analysis.
How It Functions
- Download: Obtain the pre-prepared Excel file containing Northeast Pharmaceutical Group Co., Ltd.'s financial data.
- Customize: Modify forecasts, including revenue growth, EBITDA %, and WACC as per your needs.
- Update Automatically: The calculations for intrinsic value and NPV refresh in real-time.
- Test Scenarios: Develop various projections and compare the results instantly.
- Make Decisions: Utilize the valuation outcomes to inform your investment strategy.
Why Opt for This Calculator?
- All-in-One Solution: Combines DCF, WACC, and financial ratio analyses tailored for Northeast Pharmaceutical Group Co., Ltd. (000597SZ).
- Flexible Inputs: Modify the yellow-highlighted cells to explore different financial scenarios.
- In-Depth Analysis: Automatically computes the intrinsic value and Net Present Value for Northeast Pharmaceutical Group Co., Ltd. (000597SZ).
- Ready-to-Use Data: Features historical and projected data for precise analysis initiation.
- High-Quality Standards: Perfect for financial analysts, investors, and business consultants focused on the pharmaceutical sector.
Who Should Consider Using This Product?
- Institutional Investors: Develop comprehensive and trustworthy valuation models for investment assessments.
- Corporate Finance Departments: Evaluate valuation strategies to inform internal business decisions.
- Financial Consultants and Advisors: Deliver precise valuation insights for Northeast Pharmaceutical Group Co., Ltd. (000597SZ).
- Students and Educators: Utilize real-world data to learn and teach financial modeling techniques.
- Pharmaceutical Industry Enthusiasts: Gain insights into the market valuation of pharmaceutical companies like Northeast Pharmaceutical Group Co., Ltd. (000597SZ).
Contents of the Template
- Pre-Filled DCF Model: Northeast Pharmaceutical Group Co., Ltd.'s (000597SZ) financial data loaded for immediate analysis.
- WACC Calculator: Comprehensive calculations for the Weighted Average Cost of Capital.
- Financial Ratios: Assess profitability, leverage, and efficiency metrics for Northeast Pharmaceutical Group Co., Ltd. (000597SZ).
- Editable Inputs: Modify assumptions like growth rates, margins, and CAPEX to tailor your scenarios.
- Financial Statements: Annual and quarterly reports to facilitate thorough analysis.
- Interactive Dashboard: Effortlessly visualize crucial valuation metrics and outcomes.
Disclaimer
All information, articles, and product details provided on this website are for general informational and educational purposes only. We do not claim any ownership over, nor do we intend to infringe upon, any trademarks, copyrights, logos, brand names, or other intellectual property mentioned or depicted on this site. Such intellectual property remains the property of its respective owners, and any references here are made solely for identification or informational purposes, without implying any affiliation, endorsement, or partnership.
We make no representations or warranties, express or implied, regarding the accuracy, completeness, or suitability of any content or products presented. Nothing on this website should be construed as legal, tax, investment, financial, medical, or other professional advice. In addition, no part of this site—including articles or product references—constitutes a solicitation, recommendation, endorsement, advertisement, or offer to buy or sell any securities, franchises, or other financial instruments, particularly in jurisdictions where such activity would be unlawful.
All content is of a general nature and may not address the specific circumstances of any individual or entity. It is not a substitute for professional advice or services. Any actions you take based on the information provided here are strictly at your own risk. You accept full responsibility for any decisions or outcomes arising from your use of this website and agree to release us from any liability in connection with your use of, or reliance upon, the content or products found herein.