
|
Chengdu Xingrong Environment Co., Ltd. (000598.sz) DCF -Bewertung |
Fully Editable: Tailor To Your Needs In Excel Or Sheets
Professional Design: Trusted, Industry-Standard Templates
Investor-Approved Valuation Models
MAC/PC Compatible, Fully Unlocked
No Expertise Is Needed; Easy To Follow
Chengdu Xingrong Environment Co., Ltd. (000598.SZ) Bundle
Entdecken Sie den tatsächlichen Wert von Chengdu Xingrong Environment Co., Ltd. (000598SZ) mit unserem DCF-Taschenrechner von professionellem Grade! Passen Sie die wichtigsten Annahmen an, erkunden Sie verschiedene Szenarien und beurteilen Sie, wie sich Änderungen auf die Bewertung von Chengdu Xingrong auswirken - alles innerhalb einer einzigen Excel -Vorlage.
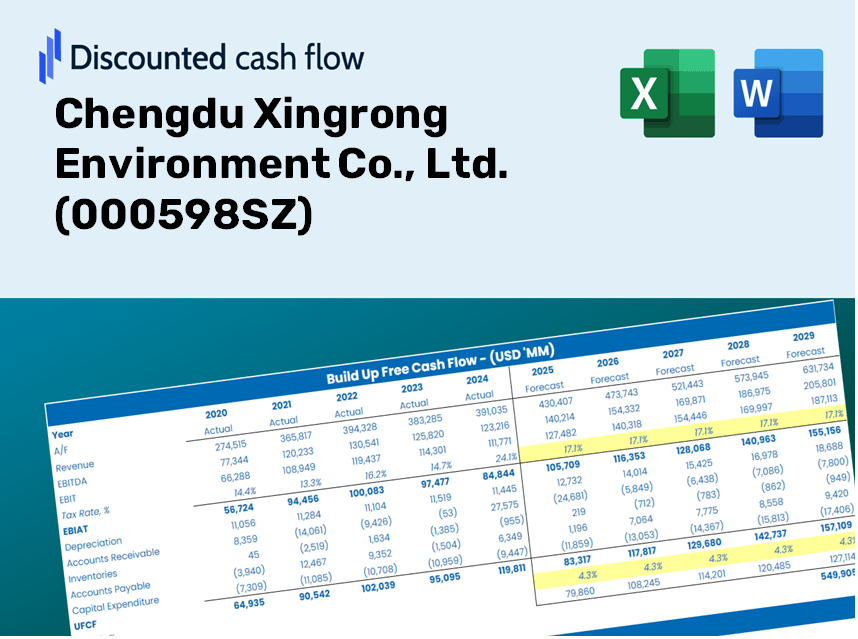
Discounted Cash Flow (DCF) - (USD MM)
| Year | AY1 2020 |
AY2 2021 |
AY3 2022 |
AY4 2023 |
AY5 2024 |
FY1 2025 |
FY2 2026 |
FY3 2027 |
FY4 2028 |
FY5 2029 |
|---|---|---|---|---|---|---|---|---|---|---|
| Revenue | 5,373.4 | 6,751.0 | 7,629.7 | 8,086.5 | 9,048.7 | 10,327.7 | 11,787.4 | 13,453.5 | 15,355.1 | 17,525.5 |
| Revenue Growth, % | 0 | 25.64 | 13.02 | 5.99 | 11.9 | 14.13 | 14.13 | 14.13 | 14.13 | 14.13 |
| EBITDA | 2,472.5 | 2,982.3 | 3,421.4 | 3,712.4 | 4,265.5 | 4,711.1 | 5,377.0 | 6,137.0 | 7,004.4 | 7,994.5 |
| EBITDA, % | 46.01 | 44.18 | 44.84 | 45.91 | 47.14 | 45.62 | 45.62 | 45.62 | 45.62 | 45.62 |
| Depreciation | 808.6 | 1,030.4 | 1,207.4 | 1,296.7 | 1,496.1 | 1,625.6 | 1,855.4 | 2,117.7 | 2,417.0 | 2,758.6 |
| Depreciation, % | 15.05 | 15.26 | 15.83 | 16.03 | 16.53 | 15.74 | 15.74 | 15.74 | 15.74 | 15.74 |
| EBIT | 1,664.0 | 1,951.9 | 2,214.0 | 2,415.8 | 2,769.4 | 3,085.4 | 3,521.6 | 4,019.3 | 4,587.4 | 5,235.8 |
| EBIT, % | 30.97 | 28.91 | 29.02 | 29.87 | 30.61 | 29.88 | 29.88 | 29.88 | 29.88 | 29.88 |
| Total Cash | 3,397.7 | 3,207.8 | 3,743.7 | 3,907.8 | 4,300.3 | 5,280.8 | 6,027.2 | 6,879.2 | 7,851.5 | 8,961.3 |
| Total Cash, percent | .0 | .0 | .0 | .0 | .0 | .0 | .0 | .0 | .0 | .0 |
| Account Receivables | 1,497.7 | 2,131.2 | 3,410.0 | 3,238.6 | 4,031.5 | 3,898.4 | 4,449.4 | 5,078.4 | 5,796.2 | 6,615.4 |
| Account Receivables, % | 27.87 | 31.57 | 44.69 | 40.05 | 44.55 | 37.75 | 37.75 | 37.75 | 37.75 | 37.75 |
| Inventories | 398.7 | 202.9 | 229.7 | 228.0 | 226.6 | 387.5 | 442.2 | 504.7 | 576.1 | 657.5 |
| Inventories, % | 7.42 | 3 | 3.01 | 2.82 | 2.5 | 3.75 | 3.75 | 3.75 | 3.75 | 3.75 |
| Accounts Payable | 4,993.9 | 5,289.6 | 3,954.1 | 6,064.0 | 6,475.2 | 7,635.5 | 8,714.8 | 9,946.5 | 11,352.4 | 12,957.0 |
| Accounts Payable, % | 92.94 | 78.35 | 51.83 | 74.99 | 71.56 | 73.93 | 73.93 | 73.93 | 73.93 | 73.93 |
| Capital Expenditure | -3,977.9 | -3,783.5 | -4,196.7 | -4,446.0 | -4,594.7 | -6,007.3 | -6,856.4 | -7,825.5 | -8,931.6 | -10,194.1 |
| Capital Expenditure, % | -74.03 | -56.04 | -55 | -54.98 | -50.78 | -58.17 | -58.17 | -58.17 | -58.17 | -58.17 |
| Tax Rate, % | 17.42 | 17.42 | 17.42 | 17.42 | 17.42 | 17.42 | 17.42 | 17.42 | 17.42 | 17.42 |
| EBITAT | 1,379.4 | 1,644.3 | 1,824.3 | 2,041.0 | 2,287.0 | 2,570.8 | 2,934.2 | 3,348.9 | 3,822.3 | 4,362.5 |
| Depreciation | ||||||||||
| Changes in Account Receivables | ||||||||||
| Changes in Inventories | ||||||||||
| Changes in Accounts Payable | ||||||||||
| Capital Expenditure | ||||||||||
| UFCF | 1,307.6 | -1,250.7 | -3,806.2 | 1,174.6 | -1,191.9 | -678.4 | -1,593.3 | -1,818.5 | -2,075.6 | -2,369.0 |
| WACC, % | 4.2 | 4.22 | 4.19 | 4.23 | 4.2 | 4.21 | 4.21 | 4.21 | 4.21 | 4.21 |
| PV UFCF | ||||||||||
| SUM PV UFCF | -7,413.1 | |||||||||
| Long Term Growth Rate, % | 0.50 | |||||||||
| Free cash flow (T + 1) | -2,381 | |||||||||
| Terminal Value | -64,208 | |||||||||
| Present Terminal Value | -52,250 | |||||||||
| Enterprise Value | -59,663 | |||||||||
| Net Debt | 7,934 | |||||||||
| Equity Value | -67,598 | |||||||||
| Diluted Shares Outstanding, MM | 2,985 | |||||||||
| Equity Value Per Share | -22.65 |
Benefits You Will Receive
- Authentic 000598SZ Financials: Access to comprehensive historical and projected data for precise valuation.
- Customizable Parameters: Adjust WACC, tax rates, growth projections, and capital expenditures according to your needs.
- Automated Calculations: Real-time computation of intrinsic value and NPV.
- Scenario Simulations: Evaluate various scenarios to assess the future performance of Chengdu Xingrong Environment Co., Ltd.
- User-Friendly Interface: Designed for industry experts while remaining easy to use for newcomers.
Key Features
- Comprehensive DCF Calculator: Features in-depth unlevered and levered DCF valuation models tailored for Chengdu Xingrong Environment Co., Ltd. (000598SZ).
- WACC Calculator: Pre-configured Weighted Average Cost of Capital worksheet with adjustable parameters.
- Customizable Forecast Assumptions: Easily update growth rates, capital expenditures, and discount rates.
- Integrated Financial Ratios: Assess profitability, leverage, and efficiency ratios specific to Chengdu Xingrong Environment Co., Ltd. (000598SZ).
- Interactive Dashboard and Charts: Visual representations highlight essential valuation metrics for straightforward analysis.
How It Works
- Download: Obtain the pre-prepared Excel file containing financial data for Chengdu Xingrong Environment Co., Ltd. (000598SZ).
- Customize: Modify projections such as revenue growth, EBITDA percentage, and WACC to fit your analysis.
- Update Automatically: Watch as intrinsic value and NPV calculations refresh in real-time.
- Test Scenarios: Generate various forecasts and evaluate different outcomes swiftly.
- Make Decisions: Leverage the valuation insights to inform your investment choices.
Why Choose Our Calculators?
- Precision: Leveraging real-time data from Chengdu Xingrong Environment Co., Ltd. (000598SZ) ensures accurate results.
- Versatility: Tailored for users to easily adjust and experiment with various inputs.
- Efficiency: Eliminate the tedious process of creating financial models from the ground up.
- Expert-Level: Built with the expertise and care expected at the CFO level.
- Intuitive: Simple and straightforward, making it accessible for individuals with minimal financial modeling knowledge.
Who Should Consider This Product?
- Institutional Investors: Develop comprehensive and trustworthy valuation models for investment assessments in Chengdu Xingrong Environment Co., Ltd. (000598SZ).
- Corporate Finance Departments: Evaluate valuation scenarios to inform strategic decision-making within the organization.
- Investment Consultants: Offer clients precise valuation analysis and insights regarding Chengdu Xingrong Environment Co., Ltd. (000598SZ).
- Academics and Students: Leverage real-world data to enhance learning and practice in financial modeling.
- Environmental Sector Enthusiasts: Gain a deeper understanding of how companies like Chengdu Xingrong Environment Co., Ltd. (000598SZ) are assessed in the market.
Contents of the Template
- Detailed DCF Model: Fully editable template featuring comprehensive valuation calculations.
- Industry-Specific Data: Historical and projected financials for Chengdu Xingrong Environment Co., Ltd. (000598SZ) preloaded for in-depth analysis.
- Adjustable Parameters: Modify WACC, growth rates, and tax assumptions to explore various scenarios.
- Financial Statements Overview: Complete annual and quarterly financial breakdowns for enhanced insights.
- Essential Ratios: Integrated analysis tools for assessing profitability, efficiency, and leverage.
- Visual Dashboard: Interactive charts and tables that present clear, actionable results.
Disclaimer
All information, articles, and product details provided on this website are for general informational and educational purposes only. We do not claim any ownership over, nor do we intend to infringe upon, any trademarks, copyrights, logos, brand names, or other intellectual property mentioned or depicted on this site. Such intellectual property remains the property of its respective owners, and any references here are made solely for identification or informational purposes, without implying any affiliation, endorsement, or partnership.
We make no representations or warranties, express or implied, regarding the accuracy, completeness, or suitability of any content or products presented. Nothing on this website should be construed as legal, tax, investment, financial, medical, or other professional advice. In addition, no part of this site—including articles or product references—constitutes a solicitation, recommendation, endorsement, advertisement, or offer to buy or sell any securities, franchises, or other financial instruments, particularly in jurisdictions where such activity would be unlawful.
All content is of a general nature and may not address the specific circumstances of any individual or entity. It is not a substitute for professional advice or services. Any actions you take based on the information provided here are strictly at your own risk. You accept full responsibility for any decisions or outcomes arising from your use of this website and agree to release us from any liability in connection with your use of, or reliance upon, the content or products found herein.