
|
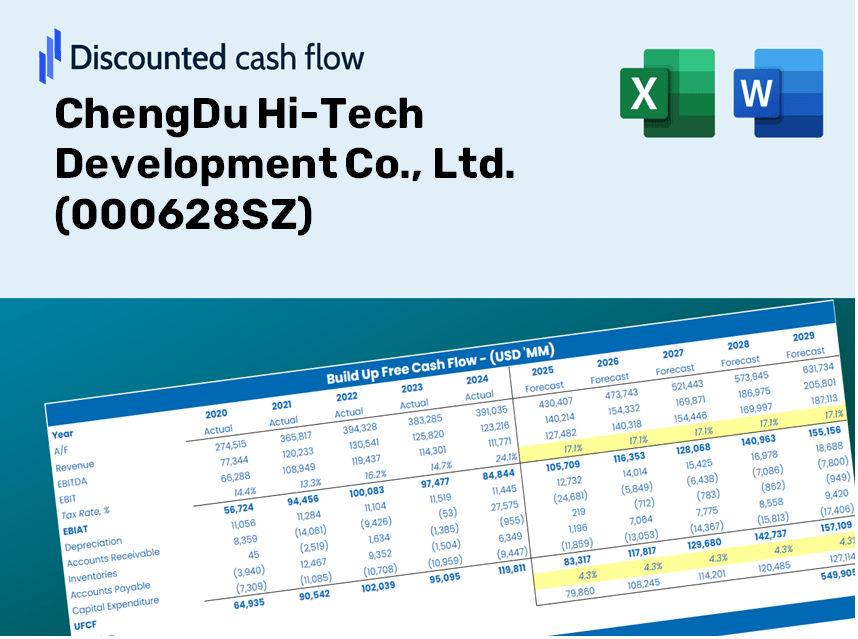
Chengdu Hi-Tech Development Co., Ltd. (000628.sz) DCF-Bewertung |
Fully Editable: Tailor To Your Needs In Excel Or Sheets
Professional Design: Trusted, Industry-Standard Templates
Investor-Approved Valuation Models
MAC/PC Compatible, Fully Unlocked
No Expertise Is Needed; Easy To Follow
ChengDu Hi-Tech Development Co., Ltd. (000628.SZ) Bundle
Bewerten Sie die finanziellen Aussichten von Chengdu Hi-Tech Development Co., Ltd. wie ein Experte! Dieser DCF-Taschenrechner (000628SZ) bietet Ihnen vorgefüllte Finanzdaten und Gesamtflexibilität, um das Umsatzwachstum, WACC, Margen und andere wesentliche Annahmen zu ändern, um sich mit Ihren Vorhersagen auszurichten.
Discounted Cash Flow (DCF) - (USD MM)
| Year | AY1 2020 |
AY2 2021 |
AY3 2022 |
AY4 2023 |
AY5 2024 |
FY1 2025 |
FY2 2026 |
FY3 2027 |
FY4 2028 |
FY5 2029 |
|---|---|---|---|---|---|---|---|---|---|---|
| Revenue | 5,533.1 | 6,611.8 | 6,570.6 | 8,008.1 | 7,127.2 | 7,657.4 | 8,226.9 | 8,838.8 | 9,496.2 | 10,202.5 |
| Revenue Growth, % | 0 | 19.5 | -0.62308 | 21.88 | -11 | 7.44 | 7.44 | 7.44 | 7.44 | 7.44 |
| EBITDA | 351.8 | 250.1 | 249.8 | 409.3 | 365.9 | 370.4 | 398.0 | 427.6 | 459.4 | 493.5 |
| EBITDA, % | 6.36 | 3.78 | 3.8 | 5.11 | 5.13 | 4.84 | 4.84 | 4.84 | 4.84 | 4.84 |
| Depreciation | 23.1 | 27.0 | 38.9 | 50.4 | 61.5 | 44.6 | 47.9 | 51.5 | 55.3 | 59.4 |
| Depreciation, % | 0.41828 | 0.4078 | 0.59189 | 0.62981 | 0.86321 | 0.5822 | 0.5822 | 0.5822 | 0.5822 | 0.5822 |
| EBIT | 328.6 | 223.1 | 210.9 | 358.9 | 304.3 | 325.8 | 350.1 | 376.1 | 404.1 | 434.1 |
| EBIT, % | 5.94 | 3.37 | 3.21 | 4.48 | 4.27 | 4.26 | 4.26 | 4.26 | 4.26 | 4.26 |
| Total Cash | 2,087.7 | 2,401.0 | 2,896.2 | 1,625.0 | 1,339.4 | 2,407.6 | 2,586.7 | 2,779.0 | 2,985.7 | 3,207.8 |
| Total Cash, percent | .0 | .0 | .0 | .0 | .0 | .0 | .0 | .0 | .0 | .0 |
| Account Receivables | 5,645.3 | 6,613.2 | 8,386.8 | 9,507.3 | 11,167.8 | 7,657.4 | 8,226.9 | 8,838.8 | 9,496.2 | 10,202.5 |
| Account Receivables, % | 102.03 | 100.02 | 127.64 | 118.72 | 156.69 | 100 | 100 | 100 | 100 | 100 |
| Inventories | 13.3 | 6.9 | 67.1 | 122.3 | 105.3 | 66.9 | 71.9 | 77.3 | 83.0 | 89.2 |
| Inventories, % | 0.24026 | 0.10448 | 1.02 | 1.53 | 1.48 | 0.87422 | 0.87422 | 0.87422 | 0.87422 | 0.87422 |
| Accounts Payable | 3,099.4 | 2,808.2 | 3,899.9 | 7,316.3 | 8,116.5 | 5,347.9 | 5,745.7 | 6,173.0 | 6,632.2 | 7,125.5 |
| Accounts Payable, % | 56.02 | 42.47 | 59.35 | 91.36 | 113.88 | 69.84 | 69.84 | 69.84 | 69.84 | 69.84 |
| Capital Expenditure | -12.8 | -63.5 | -56.6 | -299.9 | -76.4 | -105.2 | -113.0 | -121.4 | -130.5 | -140.2 |
| Capital Expenditure, % | -0.23161 | -0.95993 | -0.86102 | -3.74 | -1.07 | -1.37 | -1.37 | -1.37 | -1.37 | -1.37 |
| Tax Rate, % | 60.49 | 60.49 | 60.49 | 60.49 | 60.49 | 60.49 | 60.49 | 60.49 | 60.49 | 60.49 |
| EBITAT | 227.6 | 155.2 | 160.6 | 236.6 | 120.3 | 208.8 | 224.3 | 241.0 | 258.9 | 278.2 |
| Depreciation | ||||||||||
| Changes in Account Receivables | ||||||||||
| Changes in Inventories | ||||||||||
| Changes in Accounts Payable | ||||||||||
| Capital Expenditure | ||||||||||
| UFCF | -2,321.3 | -1,134.0 | -599.3 | 2,228.0 | -737.9 | 928.4 | -17.6 | -18.9 | -20.3 | -21.8 |
| WACC, % | 5.14 | 5.14 | 5.17 | 5.12 | 5 | 5.11 | 5.11 | 5.11 | 5.11 | 5.11 |
| PV UFCF | ||||||||||
| SUM PV UFCF | 817.5 | |||||||||
| Long Term Growth Rate, % | 4.00 | |||||||||
| Free cash flow (T + 1) | -23 | |||||||||
| Terminal Value | -2,031 | |||||||||
| Present Terminal Value | -1,583 | |||||||||
| Enterprise Value | -765 | |||||||||
| Net Debt | 1,167 | |||||||||
| Equity Value | -1,933 | |||||||||
| Diluted Shares Outstanding, MM | 352 | |||||||||
| Equity Value Per Share | -5.49 |
What You Will Get
- Authentic ChengDu Hi-Tech Data: Comprehensive financials – from revenue to EBIT – derived from real and projected figures for ChengDu Hi-Tech Development Co., Ltd. (000628SZ).
- Complete Customization: Modify all essential parameters (yellow cells) such as WACC, growth %, and tax rates to fit your analysis.
- Immediate Valuation Adjustments: Automatic recalculations to assess the effects of changes on ChengDu Hi-Tech’s fair value.
- Flexible Excel Template: Designed for easy modifications, scenario analysis, and in-depth projections.
- Efficient and Precise: Avoid starting from zero while ensuring accuracy and adaptability in your financial modeling.
Key Features
- Customizable Forecast Inputs: Adjust essential parameters such as revenue growth rates, EBITDA percentages, and capital expenditures.
- Instant DCF Valuation: Automatically computes intrinsic value, net present value, and additional outputs in real-time.
- High-Precision Accuracy: Leverages ChengDu Hi-Tech Development's real financial data to deliver credible valuation results.
- Effortless Scenario Analysis: Evaluate various assumptions and analyze results with ease.
- Efficiency Booster: Remove the complexities of constructing detailed valuation models from the ground up.
How It Functions
- Download the Template: Gain immediate access to the Excel-based ChengDu Hi-Tech DCF Calculator.
- Input Your Assumptions: Modify the yellow-highlighted cells to set growth rates, WACC, profit margins, and more.
- Instant Calculations: The model automatically recalculates the intrinsic value of ChengDu Hi-Tech (000628SZ).
- Test Scenarios: Experiment with various assumptions to see how they affect the valuation.
- Analyze and Decide: Utilize the findings to inform your investment strategies or financial evaluations.
Why Opt for This Calculator?
- Precision: Utilizes authentic ChengDu Hi-Tech financial data to guarantee accuracy.
- Versatility: Engineered for users to easily test and adjust inputs as needed.
- Efficiency: Eliminate the complexities of constructing a DCF model from the ground up.
- Corporate-Level Quality: Designed with CFO-level accuracy and user experience as priorities.
- Intuitive Interface: Simple to navigate, even for those lacking in-depth financial modeling skills.
Who Can Benefit from This Product?
- Investment Professionals: Create comprehensive and trustworthy valuation models for in-depth portfolio assessments.
- Corporate Finance Departments: Evaluate valuation scenarios to inform strategic planning within the organization.
- Consultants and Financial Advisors: Deliver precise valuation insights for ChengDu Hi-Tech Development Co., Ltd. (000628SZ).
- Students and Instructors: Leverage real-world data for practical training and education in financial modeling.
- Technology Aficionados: Gain insight into how technology firms like ChengDu Hi-Tech Development Co., Ltd. (000628SZ) are appraised in the marketplace.
Contents of the Template
- Preloaded 000628SZ Data: Historical and forecasted financial information, encompassing revenue, EBIT, and capital expenditures.
- DCF and WACC Models: Advanced sheets designed for calculating intrinsic value and the Weighted Average Cost of Capital.
- Editable Inputs: Cells highlighted in yellow for modifying revenue growth rates, tax rates, and discount factors.
- Financial Statements: Detailed annual and quarterly financial reports for extensive analysis.
- Key Ratios: Metrics for profitability, leverage, and efficiency to assess performance.
- Dashboard and Charts: Visual representations of valuation results and underlying assumptions.
Disclaimer
All information, articles, and product details provided on this website are for general informational and educational purposes only. We do not claim any ownership over, nor do we intend to infringe upon, any trademarks, copyrights, logos, brand names, or other intellectual property mentioned or depicted on this site. Such intellectual property remains the property of its respective owners, and any references here are made solely for identification or informational purposes, without implying any affiliation, endorsement, or partnership.
We make no representations or warranties, express or implied, regarding the accuracy, completeness, or suitability of any content or products presented. Nothing on this website should be construed as legal, tax, investment, financial, medical, or other professional advice. In addition, no part of this site—including articles or product references—constitutes a solicitation, recommendation, endorsement, advertisement, or offer to buy or sell any securities, franchises, or other financial instruments, particularly in jurisdictions where such activity would be unlawful.
All content is of a general nature and may not address the specific circumstances of any individual or entity. It is not a substitute for professional advice or services. Any actions you take based on the information provided here are strictly at your own risk. You accept full responsibility for any decisions or outcomes arising from your use of this website and agree to release us from any liability in connection with your use of, or reliance upon, the content or products found herein.