
|
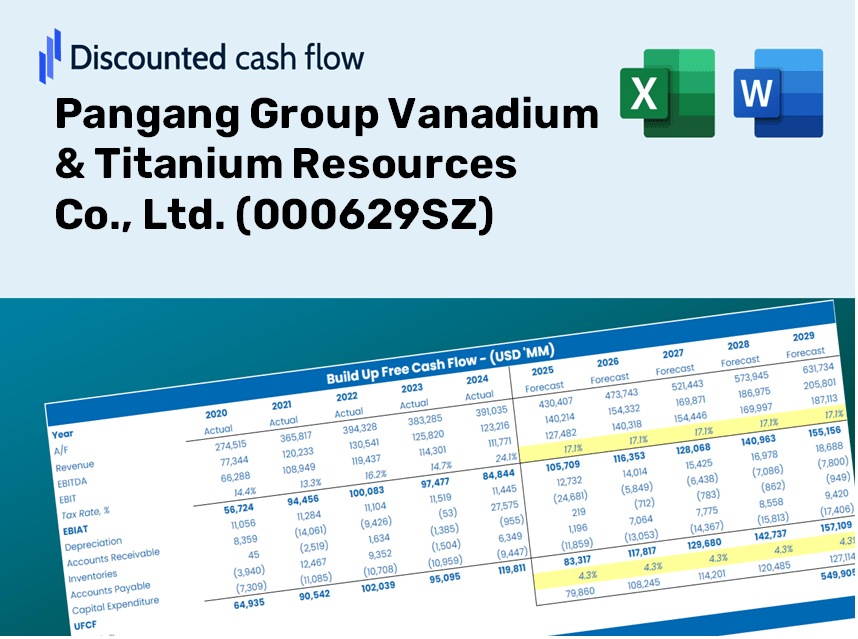
Pangang -Gruppe Vanadium & Titanium Resources Co., Ltd. (000629.Sz) DCF -Bewertung |
Fully Editable: Tailor To Your Needs In Excel Or Sheets
Professional Design: Trusted, Industry-Standard Templates
Investor-Approved Valuation Models
MAC/PC Compatible, Fully Unlocked
No Expertise Is Needed; Easy To Follow
Pangang Group Vanadium & Titanium Resources Co., Ltd. (000629.SZ) Bundle
Erforschen Sie den finanziellen Ausblick der Pangang -Gruppe Vanadium & Titanium Resources Co., Ltd. (000629SZ) mit unserem benutzerfreundlichen DCF-Taschenrechner! Geben Sie Ihre Annahmen in Bezug auf Wachstum, Margen und Kosten ein, um den inneren Wert der Pangang -Gruppe Vanadium zu berechnen & Titanium Resources Co., Ltd. (000629SZ) und verfeinern Sie Ihren Investitionsansatz.
Discounted Cash Flow (DCF) - (USD MM)
| Year | AY1 2020 |
AY2 2021 |
AY3 2022 |
AY4 2023 |
AY5 2024 |
FY1 2025 |
FY2 2026 |
FY3 2027 |
FY4 2028 |
FY5 2029 |
|---|---|---|---|---|---|---|---|---|---|---|
| Revenue | 10,538.6 | 14,060.3 | 15,087.5 | 14,380.1 | 13,208.8 | 14,129.8 | 15,115.0 | 16,168.9 | 17,296.3 | 18,502.2 |
| Revenue Growth, % | 0 | 33.42 | 7.31 | -4.69 | -8.15 | 6.97 | 6.97 | 6.97 | 6.97 | 6.97 |
| EBITDA | 823.5 | 1,941.9 | 1,704.1 | 1,430.3 | 559.9 | 1,331.2 | 1,424.0 | 1,523.3 | 1,629.5 | 1,743.1 |
| EBITDA, % | 7.81 | 13.81 | 11.29 | 9.95 | 4.24 | 9.42 | 9.42 | 9.42 | 9.42 | 9.42 |
| Depreciation | 318.0 | 314.5 | 316.5 | 324.8 | 351.6 | 346.8 | 371.0 | 396.9 | 424.6 | 454.2 |
| Depreciation, % | 3.02 | 2.24 | 2.1 | 2.26 | 2.66 | 2.45 | 2.45 | 2.45 | 2.45 | 2.45 |
| EBIT | 505.5 | 1,627.4 | 1,387.6 | 1,105.5 | 208.3 | 984.4 | 1,053.0 | 1,126.4 | 1,204.9 | 1,289.0 |
| EBIT, % | 4.8 | 11.57 | 9.2 | 7.69 | 1.58 | 6.97 | 6.97 | 6.97 | 6.97 | 6.97 |
| Total Cash | 3,394.5 | 606.8 | 2,370.7 | 4,341.4 | 4,410.5 | 3,273.0 | 3,501.2 | 3,745.3 | 4,006.5 | 4,285.8 |
| Total Cash, percent | .0 | .0 | .0 | .0 | .0 | .0 | .0 | .0 | .0 | .0 |
| Account Receivables | 678.3 | 478.8 | 582.7 | 868.2 | 345.3 | 631.8 | 675.8 | 722.9 | 773.4 | 827.3 |
| Account Receivables, % | 6.44 | 3.41 | 3.86 | 6.04 | 2.61 | 4.47 | 4.47 | 4.47 | 4.47 | 4.47 |
| Inventories | 821.2 | 1,121.4 | 985.0 | 1,103.5 | 842.1 | 1,027.1 | 1,098.7 | 1,175.3 | 1,257.3 | 1,344.9 |
| Inventories, % | 7.79 | 7.98 | 6.53 | 7.67 | 6.38 | 7.27 | 7.27 | 7.27 | 7.27 | 7.27 |
| Accounts Payable | 669.3 | 566.3 | 912.9 | 850.4 | 166.8 | 667.1 | 713.6 | 763.4 | 816.6 | 873.5 |
| Accounts Payable, % | 6.35 | 4.03 | 6.05 | 5.91 | 1.26 | 4.72 | 4.72 | 4.72 | 4.72 | 4.72 |
| Capital Expenditure | -71.1 | -38.2 | -148.1 | -479.4 | -505.0 | -256.7 | -274.6 | -293.8 | -314.3 | -336.2 |
| Capital Expenditure, % | -0.67454 | -0.27192 | -0.98158 | -3.33 | -3.82 | -1.82 | -1.82 | -1.82 | -1.82 | -1.82 |
| Tax Rate, % | 14.27 | 14.27 | 14.27 | 14.27 | 14.27 | 14.27 | 14.27 | 14.27 | 14.27 | 14.27 |
| EBITAT | 337.7 | 1,279.9 | 1,277.4 | 989.2 | 178.6 | 812.5 | 869.2 | 929.8 | 994.6 | 1,063.9 |
| Depreciation | ||||||||||
| Changes in Account Receivables | ||||||||||
| Changes in Inventories | ||||||||||
| Changes in Accounts Payable | ||||||||||
| Capital Expenditure | ||||||||||
| UFCF | -245.6 | 1,352.5 | 1,824.7 | 368.3 | 125.8 | 931.5 | 896.4 | 958.9 | 1,025.8 | 1,097.3 |
| WACC, % | 6.98 | 6.99 | 6.99 | 6.99 | 6.99 | 6.99 | 6.99 | 6.99 | 6.99 | 6.99 |
| PV UFCF | ||||||||||
| SUM PV UFCF | 4,002.3 | |||||||||
| Long Term Growth Rate, % | 2.00 | |||||||||
| Free cash flow (T + 1) | 1,119 | |||||||||
| Terminal Value | 22,433 | |||||||||
| Present Terminal Value | 16,003 | |||||||||
| Enterprise Value | 20,005 | |||||||||
| Net Debt | -1,200 | |||||||||
| Equity Value | 21,205 | |||||||||
| Diluted Shares Outstanding, MM | 9,290 | |||||||||
| Equity Value Per Share | 2.28 |
What You Will Receive
- Adjustable Forecast Inputs: Effortlessly modify assumptions (growth %, profit margins, WACC) to explore various scenarios.
- Comprehensive Data: Pangang Group Vanadium & Titanium Resources Co., Ltd.'s financial information pre-loaded to kickstart your analysis.
- Automated DCF Calculations: The template computes Net Present Value (NPV) and intrinsic value automatically.
- Flexible and Professional Design: A refined Excel model tailored to your valuation requirements.
- Designed for Analysts and Investors: Perfect for evaluating projections, assessing strategies, and enhancing efficiency.
Key Features
- Comprehensive DCF Calculator: Offers detailed unlevered and levered DCF valuation models tailored for Pangang Group Vanadium & Titanium Resources Co., Ltd. (000629SZ).
- WACC Calculator: Features a pre-built Weighted Average Cost of Capital sheet with adjustable inputs specific to the industry.
- Customizable Forecast Assumptions: Easily update growth rates, capital expenditures, and discount rates to reflect market conditions.
- Integrated Financial Ratios: Evaluate profitability, leverage, and efficiency ratios specifically for Pangang Group Vanadium & Titanium Resources Co., Ltd. (000629SZ).
- Interactive Dashboard and Charts: Provides visual representations of key valuation metrics for straightforward analysis.
How It Functions
- Step 1: Download the prebuilt Excel template featuring Pangang Group Vanadium & Titanium Resources Co., Ltd.'s data.
- Step 2: Review the pre-populated sheets to familiarize yourself with key metrics.
- Step 3: Adjust forecasts and assumptions in the editable yellow cells (WACC, growth, margins).
- Step 4: Instantly see the updated results, including the intrinsic value of Pangang Group Vanadium & Titanium Resources Co., Ltd. (000629SZ).
- Step 5: Use the outputs to make informed investment choices or generate detailed reports.
Why Choose This Calculator for Pangang Group Vanadium & Titanium Resources Co., Ltd. (000629SZ)?
- Reliable Data: Access accurate financial information specific to Pangang Group for dependable valuation outcomes.
- Highly Customizable: Tailor key inputs such as growth rates, WACC, and tax rates to align with your forecasts.
- Efficient: Built-in calculations allow you to bypass starting from scratch, saving you valuable time.
- Professional Quality: Tailored for investors, analysts, and consultants seeking in-depth insights.
- Easy to Use: User-friendly design and straightforward instructions ensure accessibility for everyone.
Who Can Benefit from This Product?
- Investors: Make informed decisions by accurately assessing the fair value of Pangang Group Vanadium & Titanium Resources Co., Ltd. (000629SZ).
- CFOs: Utilize a high-quality DCF model for comprehensive financial reporting and analysis.
- Consultants: Efficiently customize the template for client valuation reports.
- Entrepreneurs: Explore financial modeling techniques employed by leading companies in the industry.
- Educators: Implement it as a resource to illustrate valuation methods in the classroom.
Contents of the Template
- In-Depth DCF Model: An editable template featuring comprehensive valuation calculations.
- Actual Financial Data: Historical and projected financials of Pangang Group Vanadium & Titanium Resources Co., Ltd. (000629SZ) preloaded for your analysis.
- Adaptable Variables: Modify WACC, growth rates, and tax assumptions to evaluate different scenarios.
- Complete Financial Statements: Detailed annual and quarterly breakdowns for enhanced insights.
- Essential Ratios: Integrated analysis of profitability, efficiency, and leverage metrics.
- Visual Dashboard: Charts and tables providing clear, actionable insights.
Disclaimer
All information, articles, and product details provided on this website are for general informational and educational purposes only. We do not claim any ownership over, nor do we intend to infringe upon, any trademarks, copyrights, logos, brand names, or other intellectual property mentioned or depicted on this site. Such intellectual property remains the property of its respective owners, and any references here are made solely for identification or informational purposes, without implying any affiliation, endorsement, or partnership.
We make no representations or warranties, express or implied, regarding the accuracy, completeness, or suitability of any content or products presented. Nothing on this website should be construed as legal, tax, investment, financial, medical, or other professional advice. In addition, no part of this site—including articles or product references—constitutes a solicitation, recommendation, endorsement, advertisement, or offer to buy or sell any securities, franchises, or other financial instruments, particularly in jurisdictions where such activity would be unlawful.
All content is of a general nature and may not address the specific circumstances of any individual or entity. It is not a substitute for professional advice or services. Any actions you take based on the information provided here are strictly at your own risk. You accept full responsibility for any decisions or outcomes arising from your use of this website and agree to release us from any liability in connection with your use of, or reliance upon, the content or products found herein.