
|
Changchun High-Tech Industries Inc. (000661.sz) DCF-Bewertung |
Fully Editable: Tailor To Your Needs In Excel Or Sheets
Professional Design: Trusted, Industry-Standard Templates
Investor-Approved Valuation Models
MAC/PC Compatible, Fully Unlocked
No Expertise Is Needed; Easy To Follow
Changchun High-Tech Industries (Group) Inc. (000661.SZ) Bundle
Entdecken Sie das finanzielle Potenzial von Changchun High-Tech Industries (Group) Inc. (000661SZ) mit unserem benutzerfreundlichen DCF-Taschenrechner! Geben Sie einfach Ihre Annahmen für Wachstum, Margen und Kosten zur Berechnung des inneren Werts von Changchun High-Tech Industries (Group) Inc. (000661SZ) ein und verbessern Sie Ihre Anlagestrategie.
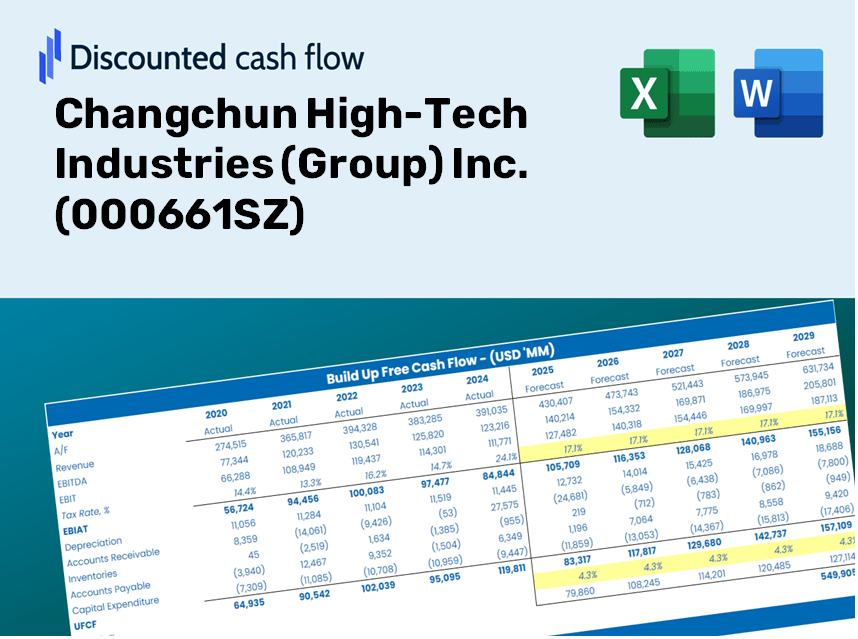
Discounted Cash Flow (DCF) - (USD MM)
| Year | AY1 2020 |
AY2 2021 |
AY3 2022 |
AY4 2023 |
AY5 2024 |
FY1 2025 |
FY2 2026 |
FY3 2027 |
FY4 2028 |
FY5 2029 |
|---|---|---|---|---|---|---|---|---|---|---|
| Revenue | 8,576.6 | 10,746.7 | 12,627.2 | 14,566.0 | 13,465.6 | 15,169.1 | 17,088.0 | 19,249.6 | 21,684.7 | 24,427.9 |
| Revenue Growth, % | 0 | 25.3 | 17.5 | 15.35 | -7.55 | 12.65 | 12.65 | 12.65 | 12.65 | 12.65 |
| EBITDA | 3,948.4 | 4,858.5 | 5,324.4 | 6,142.8 | 4,067.4 | 6,243.3 | 7,033.1 | 7,922.8 | 8,925.0 | 10,054.0 |
| EBITDA, % | 46.04 | 45.21 | 42.17 | 42.17 | 30.21 | 41.16 | 41.16 | 41.16 | 41.16 | 41.16 |
| Depreciation | 174.2 | 275.4 | 384.1 | 494.2 | 566.1 | 462.1 | 520.6 | 586.4 | 660.6 | 744.2 |
| Depreciation, % | 2.03 | 2.56 | 3.04 | 3.39 | 4.2 | 3.05 | 3.05 | 3.05 | 3.05 | 3.05 |
| EBIT | 3,774.2 | 4,583.1 | 4,940.3 | 5,648.6 | 3,501.3 | 5,781.1 | 6,512.5 | 7,336.3 | 8,264.4 | 9,309.8 |
| EBIT, % | 44.01 | 42.65 | 39.12 | 38.78 | 26 | 38.11 | 38.11 | 38.11 | 38.11 | 38.11 |
| Total Cash | 3,974.9 | 5,749.1 | 5,578.5 | 7,593.8 | 6,122.3 | 7,330.3 | 8,257.6 | 9,302.2 | 10,479.0 | 11,804.6 |
| Total Cash, percent | .0 | .0 | .0 | .0 | .0 | .0 | .0 | .0 | .0 | .0 |
| Account Receivables | 1,511.7 | 2,837.7 | 3,794.3 | 3,350.7 | 4,362.9 | 3,928.3 | 4,425.2 | 4,985.0 | 5,615.6 | 6,326.0 |
| Account Receivables, % | 17.63 | 26.4 | 30.05 | 23 | 32.4 | 25.9 | 25.9 | 25.9 | 25.9 | 25.9 |
| Inventories | 3,012.6 | 4,360.1 | 4,654.1 | 4,956.3 | 4,754.6 | 5,518.2 | 6,216.3 | 7,002.6 | 7,888.5 | 8,886.4 |
| Inventories, % | 35.13 | 40.57 | 36.86 | 34.03 | 35.31 | 36.38 | 36.38 | 36.38 | 36.38 | 36.38 |
| Accounts Payable | 313.9 | 623.8 | 628.5 | 791.1 | 771.8 | 776.8 | 875.0 | 985.7 | 1,110.4 | 1,250.9 |
| Accounts Payable, % | 3.66 | 5.8 | 4.98 | 5.43 | 5.73 | 5.12 | 5.12 | 5.12 | 5.12 | 5.12 |
| Capital Expenditure | -1,097.1 | -2,229.8 | -2,091.2 | -2,096.8 | -2,181.2 | -2,448.1 | -2,757.8 | -3,106.7 | -3,499.7 | -3,942.4 |
| Capital Expenditure, % | -12.79 | -20.75 | -16.56 | -14.4 | -16.2 | -16.14 | -16.14 | -16.14 | -16.14 | -16.14 |
| Tax Rate, % | 17.72 | 17.72 | 17.72 | 17.72 | 17.72 | 17.72 | 17.72 | 17.72 | 17.72 | 17.72 |
| EBITAT | 2,938.3 | 3,730.2 | 4,154.1 | 4,646.2 | 2,880.9 | 4,715.8 | 5,312.4 | 5,984.4 | 6,741.5 | 7,594.3 |
| Depreciation | ||||||||||
| Changes in Account Receivables | ||||||||||
| Changes in Inventories | ||||||||||
| Changes in Accounts Payable | ||||||||||
| Capital Expenditure | ||||||||||
| UFCF | -2,195.0 | -587.9 | 1,201.1 | 3,347.6 | 435.9 | 2,405.9 | 1,978.4 | 2,228.7 | 2,510.6 | 2,828.2 |
| WACC, % | 6.56 | 6.56 | 6.56 | 6.56 | 6.56 | 6.56 | 6.56 | 6.56 | 6.56 | 6.56 |
| PV UFCF | ||||||||||
| SUM PV UFCF | 9,847.8 | |||||||||
| Long Term Growth Rate, % | 3.00 | |||||||||
| Free cash flow (T + 1) | 2,913 | |||||||||
| Terminal Value | 81,843 | |||||||||
| Present Terminal Value | 59,569 | |||||||||
| Enterprise Value | 69,417 | |||||||||
| Net Debt | -4,581 | |||||||||
| Equity Value | 73,998 | |||||||||
| Diluted Shares Outstanding, MM | 402 | |||||||||
| Equity Value Per Share | 183.92 |
What You Will Receive
- Adjustable Forecast Parameters: Seamlessly modify assumptions (growth %, margins, WACC) to explore various scenarios.
- Comprehensive Data: Access to Changchun High-Tech Industries' financial information pre-loaded for your analysis.
- Automated DCF Calculations: The template computes Net Present Value (NPV) and intrinsic value automatically.
- Tailored and Professional Design: A refined Excel model that can be customized to meet your valuation requirements.
- Designed for Analysts and Investors: Perfect for assessing projections, validating strategies, and enhancing efficiency.
Key Features
- Comprehensive Historical Data: Access to Changchun High-Tech Industries' (000661SZ) past financial statements and pre-filled forecasts.
- Customizable Assumptions: Adjust WACC, tax rates, revenue growth, and EBITDA margins to suit your analysis.
- Real-Time Valuation: Instantly observe the recalculation of Changchun High-Tech Industries' (000661SZ) intrinsic value.
- Intuitive Visualizations: Dashboard charts effectively represent valuation outcomes and critical metrics.
- Designed for Precision: A reliable tool tailored for analysts, investors, and finance professionals.
How It Works
- Download the Template: Gain immediate access to the Excel-based Changchun High-Tech DCF Calculator for (000661SZ).
- Input Your Assumptions: Modify the yellow-highlighted cells for growth rates, WACC, profit margins, and other relevant factors.
- Instant Calculations: The model automatically recalculates the intrinsic value of Changchun High-Tech Industries.
- Test Scenarios: Experiment with various assumptions to assess potential changes in valuation.
- Analyze and Decide: Utilize the outcomes to inform your investment strategies or financial evaluations.
Why Choose This Calculator?
- Designed for Experts: A sophisticated tool tailored for analysts, CFOs, and industry consultants.
- Accurate Data: Preloaded financial information from Changchun High-Tech Industries (Group) Inc. (000661SZ) for reliable analysis.
- Flexible Scenario Analysis: Effortlessly test various forecasts and assumptions for insightful evaluations.
- Comprehensive Outputs: Instantly computes intrinsic value, NPV, and essential financial metrics.
- User-Friendly: Step-by-step guidance ensures a smooth and efficient experience.
Who Should Use This Product?
- Investors: Evaluate the fair value of Changchun High-Tech Industries (Group) Inc. (000661SZ) to inform your investment strategies.
- CFOs: Utilize a high-quality DCF model tailored for financial analysis and reporting related to (000661SZ).
- Consultants: Efficiently customize the template for client valuation reports focused on Changchun High-Tech Industries (Group) Inc. (000661SZ).
- Entrepreneurs: Acquire valuable insights into the financial modeling techniques employed by leading companies in the industry, including (000661SZ).
- Educators: Implement this resource as a practical tool for teaching valuation methods in finance courses.
Contents of the Template
- Comprehensive DCF Model: Editable template featuring in-depth valuation calculations.
- Real-World Data: Preloaded historical and projected financials for Changchun High-Tech Industries (Group) Inc. (000661SZ) to facilitate analysis.
- Customizable Parameters: Modify WACC, growth rates, and tax assumptions to explore various scenarios.
- Financial Statements: Detailed annual and quarterly breakdowns for enhanced insights.
- Key Ratios: Integrated analysis of profitability, efficiency, and leverage metrics.
- Dashboard with Visual Outputs: Intuitive charts and tables providing clear, actionable findings.
Disclaimer
All information, articles, and product details provided on this website are for general informational and educational purposes only. We do not claim any ownership over, nor do we intend to infringe upon, any trademarks, copyrights, logos, brand names, or other intellectual property mentioned or depicted on this site. Such intellectual property remains the property of its respective owners, and any references here are made solely for identification or informational purposes, without implying any affiliation, endorsement, or partnership.
We make no representations or warranties, express or implied, regarding the accuracy, completeness, or suitability of any content or products presented. Nothing on this website should be construed as legal, tax, investment, financial, medical, or other professional advice. In addition, no part of this site—including articles or product references—constitutes a solicitation, recommendation, endorsement, advertisement, or offer to buy or sell any securities, franchises, or other financial instruments, particularly in jurisdictions where such activity would be unlawful.
All content is of a general nature and may not address the specific circumstances of any individual or entity. It is not a substitute for professional advice or services. Any actions you take based on the information provided here are strictly at your own risk. You accept full responsibility for any decisions or outcomes arising from your use of this website and agree to release us from any liability in connection with your use of, or reliance upon, the content or products found herein.