
|
Citic Pacific Special Steel Group Co., Ltd. (000708.sz) DCF -Bewertung |
Fully Editable: Tailor To Your Needs In Excel Or Sheets
Professional Design: Trusted, Industry-Standard Templates
Investor-Approved Valuation Models
MAC/PC Compatible, Fully Unlocked
No Expertise Is Needed; Easy To Follow
Citic Pacific Special Steel Group Co., Ltd. (000708.SZ) Bundle
Unser (000708SZ) DCF -Taschenrechner wurde für die Genauigkeit konzipiert und ermöglicht es Ihnen, die Bewertung der CITIC Pacific Special Steel Group Co.
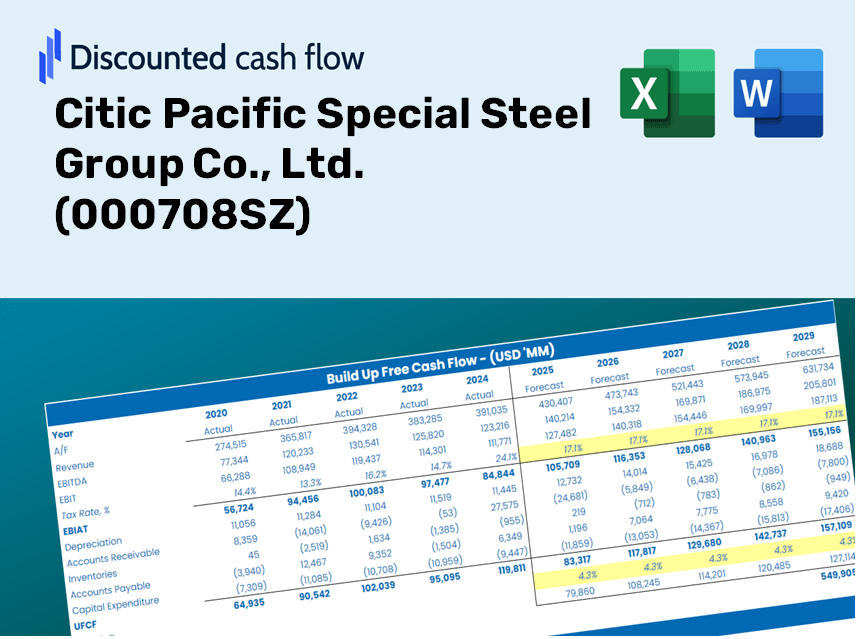
Discounted Cash Flow (DCF) - (USD MM)
| Year | AY1 2020 |
AY2 2021 |
AY3 2022 |
AY4 2023 |
AY5 2024 |
FY1 2025 |
FY2 2026 |
FY3 2027 |
FY4 2028 |
FY5 2029 |
|---|---|---|---|---|---|---|---|---|---|---|
| Revenue | 76,288.6 | 98,593.4 | 98,344.7 | 114,018.8 | 109,202.9 | 119,690.6 | 131,185.6 | 143,784.4 | 157,593.3 | 172,728.4 |
| Revenue Growth, % | 0 | 29.24 | -0.25226 | 15.94 | -4.22 | 9.6 | 9.6 | 9.6 | 9.6 | 9.6 |
| EBITDA | 11,028.4 | 13,350.0 | 11,253.4 | 11,548.8 | 11,460.1 | 14,377.9 | 15,758.7 | 17,272.2 | 18,931.0 | 20,749.1 |
| EBITDA, % | 14.46 | 13.54 | 11.44 | 10.13 | 10.49 | 12.01 | 12.01 | 12.01 | 12.01 | 12.01 |
| Depreciation | 3,045.7 | 3,086.9 | 3,268.4 | 4,681.1 | 5,014.8 | 4,582.8 | 5,022.9 | 5,505.3 | 6,034.1 | 6,613.6 |
| Depreciation, % | 3.99 | 3.13 | 3.32 | 4.11 | 4.59 | 3.83 | 3.83 | 3.83 | 3.83 | 3.83 |
| EBIT | 7,982.7 | 10,263.1 | 7,985.0 | 6,867.7 | 6,445.4 | 9,795.1 | 10,735.8 | 11,766.8 | 12,896.9 | 14,135.5 |
| EBIT, % | 10.46 | 10.41 | 8.12 | 6.02 | 5.9 | 8.18 | 8.18 | 8.18 | 8.18 | 8.18 |
| Total Cash | 9,247.2 | 7,625.3 | 8,927.9 | 8,478.0 | 8,833.5 | 10,642.5 | 11,664.5 | 12,784.8 | 14,012.6 | 15,358.4 |
| Total Cash, percent | .0 | .0 | .0 | .0 | .0 | .0 | .0 | .0 | .0 | .0 |
| Account Receivables | 11,801.7 | 13,777.2 | 15,254.9 | 22,894.9 | 19,658.3 | 19,877.5 | 21,786.5 | 23,878.8 | 26,172.1 | 28,685.6 |
| Account Receivables, % | 15.47 | 13.97 | 15.51 | 20.08 | 18 | 16.61 | 16.61 | 16.61 | 16.61 | 16.61 |
| Inventories | 8,616.7 | 9,125.6 | 10,768.0 | 17,213.8 | 16,745.1 | 14,825.1 | 16,248.9 | 17,809.5 | 19,519.9 | 21,394.5 |
| Inventories, % | 11.29 | 9.26 | 10.95 | 15.1 | 15.33 | 12.39 | 12.39 | 12.39 | 12.39 | 12.39 |
| Accounts Payable | 19,160.6 | 16,949.1 | 17,958.1 | 22,730.6 | 16,858.7 | 22,966.4 | 25,172.1 | 27,589.6 | 30,239.3 | 33,143.4 |
| Accounts Payable, % | 25.12 | 17.19 | 18.26 | 19.94 | 15.44 | 19.19 | 19.19 | 19.19 | 19.19 | 19.19 |
| Capital Expenditure | -3,174.6 | -2,523.7 | -1,787.9 | -1,997.4 | -552.4 | -2,584.5 | -2,832.7 | -3,104.8 | -3,403.0 | -3,729.8 |
| Capital Expenditure, % | -4.16 | -2.56 | -1.82 | -1.75 | -0.50587 | -2.16 | -2.16 | -2.16 | -2.16 | -2.16 |
| Tax Rate, % | 13.47 | 13.47 | 13.47 | 13.47 | 13.47 | 13.47 | 13.47 | 13.47 | 13.47 | 13.47 |
| EBITAT | 6,408.5 | 8,584.9 | 6,730.9 | 5,990.9 | 5,577.1 | 8,266.7 | 9,060.6 | 9,930.8 | 10,884.6 | 11,929.9 |
| Depreciation | ||||||||||
| Changes in Account Receivables | ||||||||||
| Changes in Inventories | ||||||||||
| Changes in Accounts Payable | ||||||||||
| Capital Expenditure | ||||||||||
| UFCF | 5,021.8 | 4,452.2 | 6,100.3 | -638.6 | 7,872.8 | 18,073.6 | 10,123.7 | 11,096.0 | 12,161.7 | 13,329.6 |
| WACC, % | 6.17 | 6.21 | 6.21 | 6.25 | 6.24 | 6.22 | 6.22 | 6.22 | 6.22 | 6.22 |
| PV UFCF | ||||||||||
| SUM PV UFCF | 54,664.4 | |||||||||
| Long Term Growth Rate, % | 2.00 | |||||||||
| Free cash flow (T + 1) | 13,596 | |||||||||
| Terminal Value | 322,516 | |||||||||
| Present Terminal Value | 238,565 | |||||||||
| Enterprise Value | 293,230 | |||||||||
| Net Debt | 23,232 | |||||||||
| Equity Value | 269,998 | |||||||||
| Diluted Shares Outstanding, MM | 5,126 | |||||||||
| Equity Value Per Share | 52.68 |
What You Will Gain
- Comprehensive (000708SZ) Financial Data: Access historical figures and projections for precise valuation.
- Customizable Inputs: Adjust variables such as WACC, tax rates, revenue growth, and capital investments.
- Dynamic Calculations: Intrinsic value and NPV are computed in real-time.
- Scenario Analysis: Evaluate various scenarios to assess the future performance of Citic Pacific Special Steel.
- User-Friendly Design: Designed for industry professionals while remaining approachable for newcomers.
Key Features
- Comprehensive Financial Data: Access precise pre-loaded historical figures and future forecasts for Citic Pacific Special Steel Group Co., Ltd. (000708SZ).
- Customizable Assumptions: Modify highlighted cells for key parameters such as WACC, growth rates, and profit margins.
- Real-Time Calculations: Automatically updated DCF, Net Present Value (NPV), and cash flow analyses.
- User-Friendly Dashboard: Intuitive charts and summaries for a clear visualization of your valuation outcomes.
- Designed for All Skill Levels: A straightforward, easy-to-navigate structure ideal for investors, CFOs, and consultants.
How It Works
- Step 1: Download the Excel file.
- Step 2: Review Citic Pacific Special Steel Group Co., Ltd.'s pre-filled financial data and forecasts.
- Step 3: Modify key inputs such as revenue growth, WACC, and tax rates (highlighted cells).
- Step 4: Observe the DCF model update in real-time as you adjust the assumptions.
- Step 5: Examine the outputs and leverage the results for investment decisions regarding Citic Pacific Special Steel Group Co., Ltd. (000708SZ).
Why Choose This Calculator for Citic Pacific Special Steel Group Co., Ltd. (000708SZ)?
- User-Friendly Interface: Tailored for both novices and seasoned professionals.
- Customizable Variables: Effortlessly adjust parameters to suit your financial analysis.
- Real-Time Adjustments: Observe immediate updates to Citic Pacific’s valuation with every input change.
- Pre-Configured Data: Comes loaded with Citic Pacific’s latest financial information for swift evaluations.
- Expert Endorsement: Widely utilized by investors and analysts for making well-informed choices.
Who Should Consider This Product?
- Investors: Evaluate Citic Pacific Special Steel Group Co., Ltd. (000708SZ)'s valuation prior to making investment decisions.
- CFOs and Financial Analysts: Optimize valuation workflows and assess financial forecasts.
- Startup Founders: Understand the valuation methodologies applied to large public entities like Citic Pacific Special Steel Group Co., Ltd. (000708SZ).
- Consultants: Provide detailed valuation analyses for client projects.
- Students and Educators: Leverage actual data to learn and instruct on valuation practices.
Contents of the Template
- Operating and Balance Sheet Data: Pre-filled historical data and projections for Citic Pacific Special Steel Group Co., Ltd. (000708SZ), including revenue, EBITDA, EBIT, and capital expenditures.
- WACC Calculation: A dedicated section for the Weighted Average Cost of Capital (WACC), featuring parameters such as Beta, risk-free rate, and share price.
- DCF Valuation (Unlevered and Levered): Customizable Discounted Cash Flow models that present intrinsic value along with comprehensive calculations.
- Financial Statements: Pre-loaded annual and quarterly financial statements for supporting analysis.
- Key Ratios: Includes profitability, leverage, and efficiency ratios specific to Citic Pacific Special Steel Group Co., Ltd. (000708SZ).
- Dashboard and Charts: A visual overview of valuation results and assumptions for simplified analysis.
Disclaimer
All information, articles, and product details provided on this website are for general informational and educational purposes only. We do not claim any ownership over, nor do we intend to infringe upon, any trademarks, copyrights, logos, brand names, or other intellectual property mentioned or depicted on this site. Such intellectual property remains the property of its respective owners, and any references here are made solely for identification or informational purposes, without implying any affiliation, endorsement, or partnership.
We make no representations or warranties, express or implied, regarding the accuracy, completeness, or suitability of any content or products presented. Nothing on this website should be construed as legal, tax, investment, financial, medical, or other professional advice. In addition, no part of this site—including articles or product references—constitutes a solicitation, recommendation, endorsement, advertisement, or offer to buy or sell any securities, franchises, or other financial instruments, particularly in jurisdictions where such activity would be unlawful.
All content is of a general nature and may not address the specific circumstances of any individual or entity. It is not a substitute for professional advice or services. Any actions you take based on the information provided here are strictly at your own risk. You accept full responsibility for any decisions or outcomes arising from your use of this website and agree to release us from any liability in connection with your use of, or reliance upon, the content or products found herein.