
|
Kingland Technology Co., Ltd. (000711.sz) DCF -Bewertung |
Fully Editable: Tailor To Your Needs In Excel Or Sheets
Professional Design: Trusted, Industry-Standard Templates
Investor-Approved Valuation Models
MAC/PC Compatible, Fully Unlocked
No Expertise Is Needed; Easy To Follow
Kingland Technology Co.,Ltd. (000711.SZ) Bundle
Unser (000711SZ) DCF-Taschenrechner entwickelt für die Genauigkeit und ermöglicht es Ihnen, die Bewertung von Kingland Technology Co., Ltd. unter Verwendung realer Finanzdaten zu bewerten, und bietet vollständige Flexibilität, um alle wesentlichen Parameter für erweiterte Projektionen zu ändern.
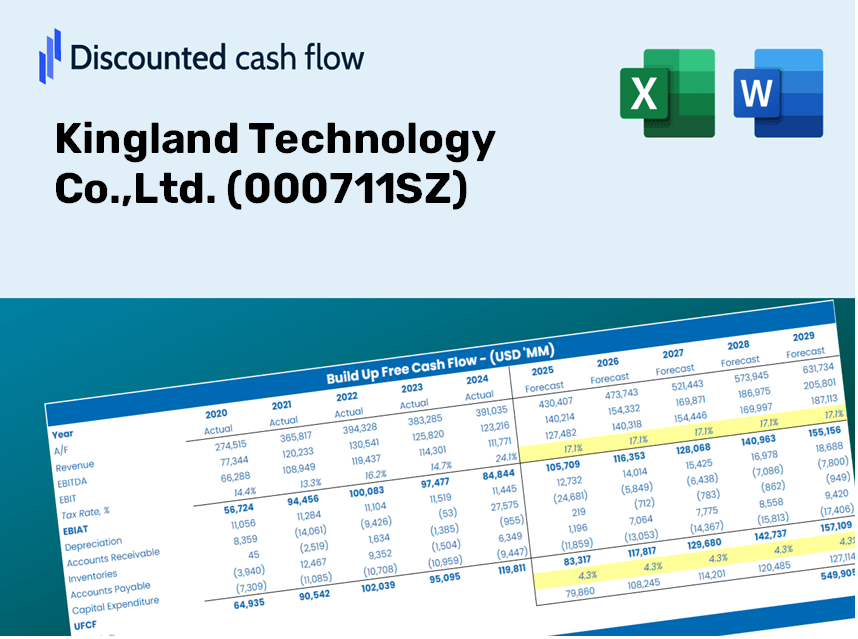
Discounted Cash Flow (DCF) - (USD MM)
| Year | AY1 2020 |
AY2 2021 |
AY3 2022 |
AY4 2023 |
AY5 2024 |
FY1 2025 |
FY2 2026 |
FY3 2027 |
FY4 2028 |
FY5 2029 |
|---|---|---|---|---|---|---|---|---|---|---|
| Revenue | 1,158.3 | 738.0 | 195.2 | 148.9 | 377.9 | 346.2 | 317.2 | 290.6 | 266.2 | 243.9 |
| Revenue Growth, % | 0 | -36.29 | -73.55 | -23.69 | 153.69 | -8.38 | -8.38 | -8.38 | -8.38 | -8.38 |
| EBITDA | -1,770.9 | -694.3 | -1,055.9 | 1,361.1 | -109.6 | -154.5 | -141.5 | -129.7 | -118.8 | -108.8 |
| EBITDA, % | -152.88 | -94.07 | -541.03 | 913.84 | -29.02 | -44.62 | -44.62 | -44.62 | -44.62 | -44.62 |
| Depreciation | 83.6 | 78.8 | 61.2 | 72.7 | 21.4 | 71.8 | 65.8 | 60.3 | 55.2 | 50.6 |
| Depreciation, % | 7.22 | 10.68 | 31.34 | 48.81 | 5.66 | 20.74 | 20.74 | 20.74 | 20.74 | 20.74 |
| EBIT | -1,854.5 | -773.1 | -1,117.1 | 1,288.4 | -131.0 | -162.5 | -148.9 | -136.4 | -125.0 | -114.5 |
| EBIT, % | -160.1 | -104.75 | -572.37 | 865.03 | -34.68 | -46.94 | -46.94 | -46.94 | -46.94 | -46.94 |
| Total Cash | 321.4 | 125.2 | 138.2 | 476.7 | 17.3 | 152.4 | 139.6 | 127.9 | 117.2 | 107.4 |
| Total Cash, percent | .0 | .0 | .0 | .0 | .0 | .0 | .0 | .0 | .0 | .0 |
| Account Receivables | 4,396.6 | 4,055.6 | 3,497.8 | 659.7 | 576.9 | 346.2 | 317.2 | 290.6 | 266.2 | 243.9 |
| Account Receivables, % | 379.56 | 549.53 | 1792.22 | 442.93 | 152.69 | 100 | 100 | 100 | 100 | 100 |
| Inventories | 789.1 | 746.5 | 680.3 | 4.4 | 114.3 | 208.6 | 191.1 | 175.1 | 160.4 | 147.0 |
| Inventories, % | 68.13 | 101.16 | 348.59 | 2.93 | 30.25 | 60.26 | 60.26 | 60.26 | 60.26 | 60.26 |
| Accounts Payable | 1,872.4 | 2,013.2 | 1,885.3 | 402.6 | 251.0 | 322.9 | 295.9 | 271.1 | 248.3 | 227.5 |
| Accounts Payable, % | 161.65 | 272.79 | 966.02 | 270.28 | 66.42 | 93.28 | 93.28 | 93.28 | 93.28 | 93.28 |
| Capital Expenditure | -110.5 | -21.0 | -5.6 | -.6 | -22.2 | -14.9 | -13.7 | -12.5 | -11.5 | -10.5 |
| Capital Expenditure, % | -9.54 | -2.84 | -2.86 | -0.41049 | -5.87 | -4.3 | -4.3 | -4.3 | -4.3 | -4.3 |
| Tax Rate, % | 17.61 | 17.61 | 17.61 | 17.61 | 17.61 | 17.61 | 17.61 | 17.61 | 17.61 | 17.61 |
| EBITAT | -1,891.7 | -775.8 | -1,086.7 | 1,553.6 | -108.0 | -155.9 | -142.8 | -130.8 | -119.9 | -109.8 |
| Depreciation | ||||||||||
| Changes in Account Receivables | ||||||||||
| Changes in Inventories | ||||||||||
| Changes in Accounts Payable | ||||||||||
| Capital Expenditure | ||||||||||
| UFCF | -5,231.9 | -193.6 | -535.1 | 3,657.0 | -287.5 | 109.4 | -71.2 | -65.3 | -59.8 | -54.8 |
| WACC, % | 4.58 | 4.58 | 4.58 | 4.58 | 4.57 | 4.58 | 4.58 | 4.58 | 4.58 | 4.58 |
| PV UFCF | ||||||||||
| SUM PV UFCF | -111.4 | |||||||||
| Long Term Growth Rate, % | 2.00 | |||||||||
| Free cash flow (T + 1) | -56 | |||||||||
| Terminal Value | -2,169 | |||||||||
| Present Terminal Value | -1,734 | |||||||||
| Enterprise Value | -1,845 | |||||||||
| Net Debt | -12 | |||||||||
| Equity Value | -1,834 | |||||||||
| Diluted Shares Outstanding, MM | 2,857 | |||||||||
| Equity Value Per Share | -0.64 |
What You Will Receive
- Authentic KLT Financials: Provides historical and projected data for precise valuation.
- Customizable Inputs: Adjust WACC, tax rates, revenue growth, and capital expenditures as needed.
- Dynamic Calculations: Intrinsic value and NPV are computed in real-time.
- Scenario Analysis: Explore various scenarios to assess Kingland Technology’s future prospects.
- User-Friendly Design: Designed for professionals while remaining approachable for newcomers.
Key Features
- 🔍 Real-Life Kingland Financials: Pre-filled historical and projected data for Kingland Technology Co., Ltd. (000711SZ).
- ✏️ Fully Customizable Inputs: Modify all essential parameters (yellow cells) such as WACC, growth %, and tax rates.
- 📊 Professional DCF Valuation: Built-in formulas compute Kingland’s intrinsic value using the Discounted Cash Flow method.
- ⚡ Instant Results: Visualize Kingland’s valuation immediately after making adjustments.
- Scenario Analysis: Evaluate and compare outcomes for different financial assumptions side-by-side.
How It Functions
- 1. Access the Template: Download and open the Excel file containing Kingland Technology Co., Ltd.'s (000711SZ) preloaded data.
- 2. Adjust Assumptions: Modify essential inputs such as growth rates, WACC, and capital expenditures.
- 3. View Results in Real-Time: The DCF model automatically calculates intrinsic value and NPV.
- 4. Explore Scenarios: Analyze different valuation outcomes by comparing various forecasts.
- 5. Utilize with Assurance: Present expert valuation insights to inform your decision-making.
Why Choose This Calculator for Kingland Technology Co., Ltd. (000711SZ)?
- Tailored for Industry Experts: A sophisticated tool favored by analysts, CFOs, and consultants in the tech sector.
- Accurate Financial Insights: Historical and projected financial data for Kingland preloaded to ensure precision.
- Comprehensive Scenario Analysis: Effortlessly model various forecasts and assumptions.
- Intuitive Results: Automatically computes intrinsic value, NPV, and essential financial metrics.
- User-Friendly Experience: Clear, step-by-step guidance throughout the calculation process.
Who Can Benefit from Kingland Technology Co., Ltd. (000711SZ)?
- Investors: Enhance your decision-making with a sophisticated valuation tool tailored for Kingland Technology.
- Financial Analysts: Save valuable time with a customizable DCF model specifically designed for analyzing Kingland Technology's performance.
- Consultants: Effortlessly adapt the template for impactful client presentations or reports focusing on Kingland Technology.
- Finance Enthusiasts: Expand your knowledge of valuation methods through real-world applications related to Kingland Technology.
- Educators and Students: Utilize this tool as a hands-on resource in finance courses, specifically examining Kingland Technology's market strategies.
Overview of the Template
- Preloaded Kingland Data: Historical and projected financial figures, including revenue, EBIT, and capital investments.
- DCF and WACC Models: Advanced templates for determining intrinsic value and Weighted Average Cost of Capital.
- Customizable Inputs: Cells highlighted in yellow for modifying revenue growth, tax rates, and discount rates.
- Financial Statements: Detailed annual and quarterly financial reports for in-depth evaluation.
- Key Ratios: Metrics for profitability, leverage, and efficiency to assess performance.
- Dashboard and Visualizations: Graphical representations of valuation results and underlying assumptions.
Disclaimer
All information, articles, and product details provided on this website are for general informational and educational purposes only. We do not claim any ownership over, nor do we intend to infringe upon, any trademarks, copyrights, logos, brand names, or other intellectual property mentioned or depicted on this site. Such intellectual property remains the property of its respective owners, and any references here are made solely for identification or informational purposes, without implying any affiliation, endorsement, or partnership.
We make no representations or warranties, express or implied, regarding the accuracy, completeness, or suitability of any content or products presented. Nothing on this website should be construed as legal, tax, investment, financial, medical, or other professional advice. In addition, no part of this site—including articles or product references—constitutes a solicitation, recommendation, endorsement, advertisement, or offer to buy or sell any securities, franchises, or other financial instruments, particularly in jurisdictions where such activity would be unlawful.
All content is of a general nature and may not address the specific circumstances of any individual or entity. It is not a substitute for professional advice or services. Any actions you take based on the information provided here are strictly at your own risk. You accept full responsibility for any decisions or outcomes arising from your use of this website and agree to release us from any liability in connection with your use of, or reliance upon, the content or products found herein.