
|
China Zhenhua Science & Technology Co., Ltd (000733.SZ) DCF -Bewertung |
Fully Editable: Tailor To Your Needs In Excel Or Sheets
Professional Design: Trusted, Industry-Standard Templates
Investor-Approved Valuation Models
MAC/PC Compatible, Fully Unlocked
No Expertise Is Needed; Easy To Follow
China Zhenhua (Group) Science & Technology Co., Ltd (000733.SZ) Bundle
Bewerten Sie die finanziellen Aussichten der China Zhenhua (Gruppen-) Wissenschaft & Technology Co., Ltd wie ein Experte! Dieser DCF-Taschenrechner (000733SZ) liefert vorgefüllte Finanzdaten sowie umfassende Flexibilität, um das Umsatzwachstum, WACC, Margen und andere kritische Annahmen zu ändern, um sich an Ihren Projektionen anzupassen.
Discounted Cash Flow (DCF) - (USD MM)
| Year | AY1 2020 |
AY2 2021 |
AY3 2022 |
AY4 2023 |
AY5 2024 |
FY1 2025 |
FY2 2026 |
FY3 2027 |
FY4 2028 |
FY5 2029 |
|---|---|---|---|---|---|---|---|---|---|---|
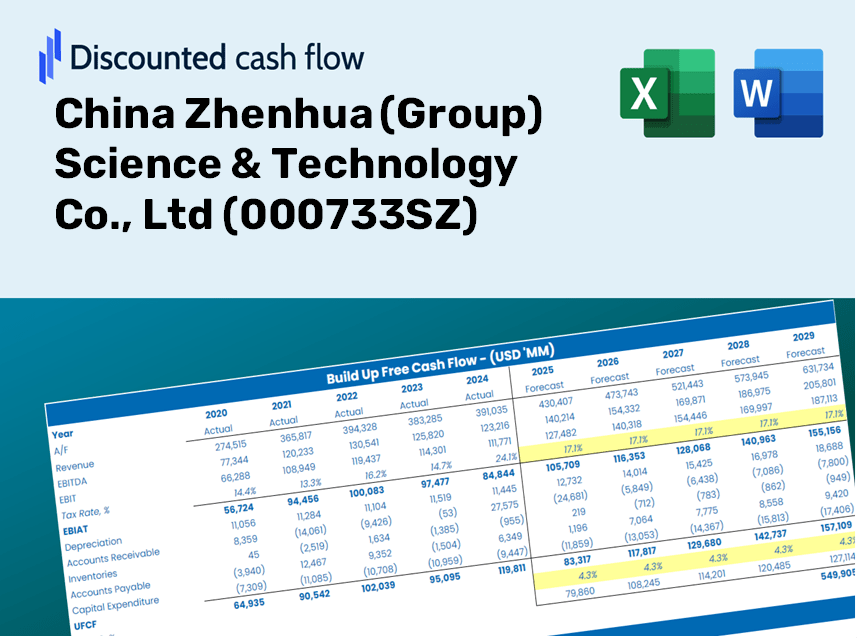
| Revenue | 3,949.7 | 5,656.0 | 7,266.9 | 7,789.3 | 5,219.3 | 5,817.9 | 6,485.1 | 7,228.9 | 8,057.9 | 8,982.1 |
| Revenue Growth, % | 0 | 43.2 | 28.48 | 7.19 | -32.99 | 11.47 | 11.47 | 11.47 | 11.47 | 11.47 |
| EBITDA | 1,060.6 | 1,902.7 | 2,996.6 | 3,233.5 | 1,263.9 | 1,948.5 | 2,172.0 | 2,421.1 | 2,698.7 | 3,008.3 |
| EBITDA, % | 26.85 | 33.64 | 41.24 | 41.51 | 24.22 | 33.49 | 33.49 | 33.49 | 33.49 | 33.49 |
| Depreciation | 193.0 | 217.6 | 245.3 | 262.4 | 291.7 | 245.1 | 273.2 | 304.6 | 339.5 | 378.5 |
| Depreciation, % | 4.89 | 3.85 | 3.38 | 3.37 | 5.59 | 4.21 | 4.21 | 4.21 | 4.21 | 4.21 |
| EBIT | 867.6 | 1,685.1 | 2,751.2 | 2,971.1 | 972.3 | 1,703.4 | 1,898.7 | 2,116.5 | 2,359.2 | 2,629.8 |
| EBIT, % | 21.97 | 29.79 | 37.86 | 38.14 | 18.63 | 29.28 | 29.28 | 29.28 | 29.28 | 29.28 |
| Total Cash | 917.7 | 1,647.9 | 1,811.1 | 4,683.1 | 5,026.6 | 2,719.5 | 3,031.4 | 3,379.1 | 3,766.7 | 4,198.7 |
| Total Cash, percent | .0 | .0 | .0 | .0 | .0 | .0 | .0 | .0 | .0 | .0 |
| Account Receivables | 3,700.9 | 4,230.5 | 5,713.1 | 7,272.4 | 6,762.4 | 5,125.3 | 5,713.1 | 6,368.4 | 7,098.7 | 7,912.9 |
| Account Receivables, % | 93.7 | 74.8 | 78.62 | 93.36 | 129.57 | 88.1 | 88.1 | 88.1 | 88.1 | 88.1 |
| Inventories | 1,096.8 | 1,846.1 | 2,288.3 | 2,096.5 | 2,243.4 | 1,882.6 | 2,098.6 | 2,339.2 | 2,607.5 | 2,906.6 |
| Inventories, % | 27.77 | 32.64 | 31.49 | 26.92 | 42.98 | 32.36 | 32.36 | 32.36 | 32.36 | 32.36 |
| Accounts Payable | 883.1 | 1,340.3 | 1,650.9 | 1,103.7 | 1,331.8 | 1,262.0 | 1,406.8 | 1,568.1 | 1,748.0 | 1,948.4 |
| Accounts Payable, % | 22.36 | 23.7 | 22.72 | 14.17 | 25.52 | 21.69 | 21.69 | 21.69 | 21.69 | 21.69 |
| Capital Expenditure | -400.3 | -476.6 | -438.2 | -464.3 | -462.7 | -458.7 | -511.3 | -569.9 | -635.3 | -708.1 |
| Capital Expenditure, % | -10.13 | -8.43 | -6.03 | -5.96 | -8.87 | -7.88 | -7.88 | -7.88 | -7.88 | -7.88 |
| Tax Rate, % | 12.66 | 12.66 | 12.66 | 12.66 | 12.66 | 12.66 | 12.66 | 12.66 | 12.66 | 12.66 |
| EBITAT | 720.4 | 1,428.0 | 2,381.5 | 2,555.2 | 849.1 | 1,457.0 | 1,624.1 | 1,810.3 | 2,018.0 | 2,249.4 |
| Depreciation | ||||||||||
| Changes in Account Receivables | ||||||||||
| Changes in Inventories | ||||||||||
| Changes in Accounts Payable | ||||||||||
| Capital Expenditure | ||||||||||
| UFCF | -3,401.5 | 347.3 | 574.5 | 438.5 | 1,269.3 | 3,171.6 | 727.1 | 810.5 | 903.4 | 1,007.0 |
| WACC, % | 4.5 | 4.51 | 4.51 | 4.51 | 4.51 | 4.51 | 4.51 | 4.51 | 4.51 | 4.51 |
| PV UFCF | ||||||||||
| SUM PV UFCF | 5,975.6 | |||||||||
| Long Term Growth Rate, % | 3.50 | |||||||||
| Free cash flow (T + 1) | 1,042 | |||||||||
| Terminal Value | 103,359 | |||||||||
| Present Terminal Value | 82,907 | |||||||||
| Enterprise Value | 88,883 | |||||||||
| Net Debt | -2,214 | |||||||||
| Equity Value | 91,096 | |||||||||
| Diluted Shares Outstanding, MM | 554 | |||||||||
| Equity Value Per Share | 164.43 |
Benefits You Will Receive
- Pre-Loaded Financial Model: Utilize China Zhenhua’s actual data for accurate DCF valuation.
- Comprehensive Forecast Control: Modify revenue growth, profit margins, WACC, and other essential variables.
- Real-Time Calculations: Instant updates allow you to view results as adjustments are made.
- Professional Template: A polished Excel file crafted for high-level valuation tasks.
- Flexible and Reusable: Designed for adaptability, enabling repeated use for in-depth forecasts.
Key Features
- Authentic Historical Data for China Zhenhua: Pre-loaded with the company's past financial performance and future projections.
- Comprehensive Customization Options: Tailor inputs for revenue growth, profit margins, WACC, tax rates, and capital expenditures.
- Adaptive Valuation Model: Automatically recalculates Net Present Value (NPV) and intrinsic value according to your parameters.
- Scenario Analysis: Develop and assess multiple forecasting scenarios to explore various valuation possibilities.
- User-Centric Interface: Intuitive and organized, suitable for both seasoned professionals and newcomers.
How It Works
- Step 1: Download the prebuilt Excel template containing data for China Zhenhua (Group) Science & Technology Co., Ltd (000733SZ).
- Step 2: Review the pre-filled sheets to familiarize yourself with the essential metrics.
- Step 3: Adjust forecasts and assumptions in the editable yellow cells (WACC, growth, margins) as needed.
- Step 4: Instantly see the recalculated results, highlighting China Zhenhua’s intrinsic value.
- Step 5: Use the outputs to make informed investment choices or create detailed reports.
Why Opt for This Calculator?
- User-Friendly and Accessible: Tailored for both novices and seasoned professionals.
- Customizable Variables: Seamlessly adjust inputs to suit your analytical needs.
- Real-Time Adjustments: Observe immediate updates to China Zhenhua (Group) Science & Technology Co., Ltd (000733SZ) valuation as you tweak the inputs.
- Pre-Configured: Comes with China Zhenhua's latest financial data for swift evaluation.
- Relied Upon by Experts: Utilized by investors and analysts for well-informed decision-making.
Who Can Benefit from This Product?
- Finance Students: Explore valuation methodologies and apply them using authentic data from China Zhenhua (Group) Science & Technology Co., Ltd (000733SZ).
- Researchers: Integrate established financial models into your academic studies or research projects.
- Investors: Validate your investment hypotheses and evaluate valuation results for China Zhenhua (Group) Science & Technology Co., Ltd (000733SZ).
- Financial Analysts: Optimize your analysis process with a customizable DCF model tailored for China Zhenhua (Group) Science & Technology Co., Ltd (000733SZ).
- Entrepreneurs: Understand the analytical techniques used for assessing large public entities like China Zhenhua (Group) Science & Technology Co., Ltd (000733SZ).
Contents of the Template
- Operating and Balance Sheet Data: Pre-filled historical data and forecasts for China Zhenhua (Group) Science & Technology Co., Ltd (000733SZ), including revenue, EBITDA, EBIT, and capital expenditures.
- WACC Calculation: A dedicated sheet for calculating the Weighted Average Cost of Capital (WACC), featuring essential parameters such as Beta, risk-free rate, and share price.
- DCF Valuation (Unlevered and Levered): Customizable Discounted Cash Flow models that present intrinsic value along with comprehensive calculations.
- Financial Statements: Pre-loaded annual and quarterly financial statements to facilitate in-depth analysis.
- Key Ratios: Includes various profitability, leverage, and efficiency ratios relevant to China Zhenhua (Group) Science & Technology Co., Ltd (000733SZ).
- Dashboard and Charts: A visual summary of valuation outputs and assumptions for easy analysis of results.
Disclaimer
All information, articles, and product details provided on this website are for general informational and educational purposes only. We do not claim any ownership over, nor do we intend to infringe upon, any trademarks, copyrights, logos, brand names, or other intellectual property mentioned or depicted on this site. Such intellectual property remains the property of its respective owners, and any references here are made solely for identification or informational purposes, without implying any affiliation, endorsement, or partnership.
We make no representations or warranties, express or implied, regarding the accuracy, completeness, or suitability of any content or products presented. Nothing on this website should be construed as legal, tax, investment, financial, medical, or other professional advice. In addition, no part of this site—including articles or product references—constitutes a solicitation, recommendation, endorsement, advertisement, or offer to buy or sell any securities, franchises, or other financial instruments, particularly in jurisdictions where such activity would be unlawful.
All content is of a general nature and may not address the specific circumstances of any individual or entity. It is not a substitute for professional advice or services. Any actions you take based on the information provided here are strictly at your own risk. You accept full responsibility for any decisions or outcomes arising from your use of this website and agree to release us from any liability in connection with your use of, or reliance upon, the content or products found herein.