
|
Sealand Securities Co., Ltd. (000750.sz) DCF -Bewertung |
Fully Editable: Tailor To Your Needs In Excel Or Sheets
Professional Design: Trusted, Industry-Standard Templates
Investor-Approved Valuation Models
MAC/PC Compatible, Fully Unlocked
No Expertise Is Needed; Easy To Follow
Sealand Securities Co., Ltd. (000750.SZ) Bundle
Optimieren Sie Ihre Analyse und verbessern Sie die Präzision mit unserem DCF -Taschenrechner (000750SZ)! Dieses Tool wird durch reale Daten von Sealand Securities Co., Ltd. und anpassbaren Annahmen angetrieben und ermöglicht es Ihnen, den Wert von Sealand -Wertpapieren wie einen erfahrenen professionellen Investor zu prognostizieren, zu analysieren und zu bewerten.
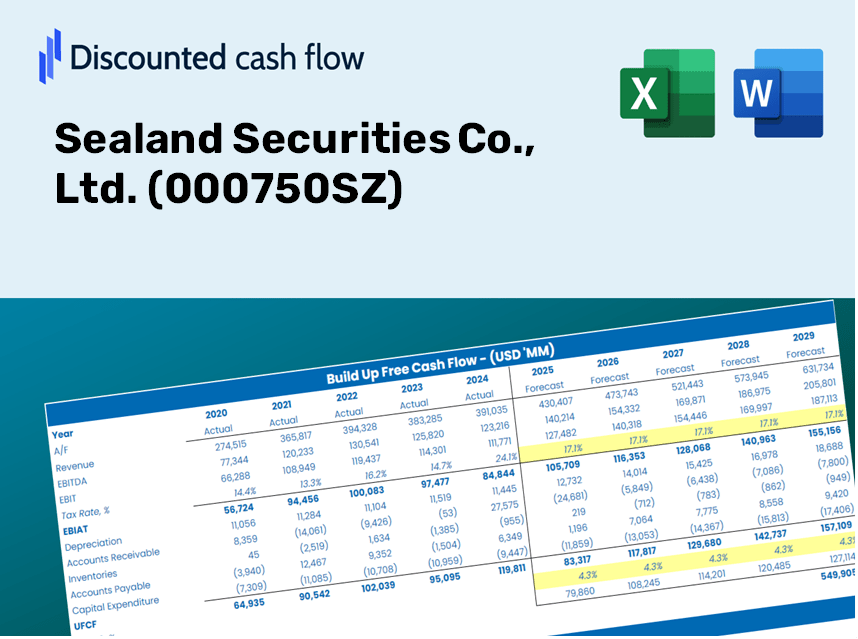
Discounted Cash Flow (DCF) - (USD MM)
| Year | AY1 2020 |
AY2 2021 |
AY3 2022 |
AY4 2023 |
AY5 2024 |
FY1 2025 |
FY2 2026 |
FY3 2027 |
FY4 2028 |
FY5 2029 |
|---|---|---|---|---|---|---|---|---|---|---|
| Revenue | 4,488.7 | 6,311.1 | 4,661.7 | 4,144.6 | 4,909.6 | 5,177.5 | 5,460.1 | 5,758.1 | 6,072.3 | 6,403.7 |
| Revenue Growth, % | 0 | 40.6 | -26.13 | -11.09 | 18.46 | 5.46 | 5.46 | 5.46 | 5.46 | 5.46 |
| EBITDA | 2,705.3 | 2,796.2 | 1,595.1 | .0 | -5.9 | 1,435.9 | 1,514.3 | 1,597.0 | 1,684.1 | 1,776.0 |
| EBITDA, % | 60.27 | 44.31 | 34.22 | 0 | -0.11985 | 27.73 | 27.73 | 27.73 | 27.73 | 27.73 |
| Depreciation | 107.1 | 219.3 | 226.2 | 233.4 | 231.4 | 218.1 | 230.0 | 242.5 | 255.7 | 269.7 |
| Depreciation, % | 2.38 | 3.48 | 4.85 | 5.63 | 4.71 | 4.21 | 4.21 | 4.21 | 4.21 | 4.21 |
| EBIT | 2,598.2 | 2,576.8 | 1,368.9 | -233.4 | -237.3 | 1,217.9 | 1,284.4 | 1,354.4 | 1,428.4 | 1,506.3 |
| EBIT, % | 57.88 | 40.83 | 29.36 | -5.63 | -4.83 | 23.52 | 23.52 | 23.52 | 23.52 | 23.52 |
| Total Cash | 27,731.9 | 35,220.4 | 38,116.9 | 9,288.8 | 6,479.1 | 5,177.5 | 5,460.1 | 5,758.1 | 6,072.3 | 6,403.7 |
| Total Cash, percent | .0 | .0 | .0 | .0 | .0 | .0 | .0 | .0 | .0 | .0 |
| Account Receivables | 10,406.8 | 13,279.0 | 11,553.7 | 11,960.8 | 336.1 | 4,212.9 | 4,442.8 | 4,685.3 | 4,941.0 | 5,210.6 |
| Account Receivables, % | 231.85 | 210.41 | 247.84 | 288.59 | 6.85 | 81.37 | 81.37 | 81.37 | 81.37 | 81.37 |
| Inventories | .0 | 19,795.6 | 23,010.3 | .0 | .0 | 2,071.0 | 2,184.0 | 2,303.2 | 2,428.9 | 2,561.5 |
| Inventories, % | 0 | 313.66 | 493.6 | 0 | 0 | 40 | 40 | 40 | 40 | 40 |
| Accounts Payable | 90.8 | 2,088.5 | 771.7 | 501.2 | 317.4 | 727.2 | 766.9 | 808.7 | 852.9 | 899.4 |
| Accounts Payable, % | 2.02 | 33.09 | 16.55 | 12.09 | 6.46 | 14.05 | 14.05 | 14.05 | 14.05 | 14.05 |
| Capital Expenditure | -1,454.8 | -247.2 | -187.1 | -180.2 | -100.8 | -484.0 | -510.4 | -538.3 | -567.6 | -598.6 |
| Capital Expenditure, % | -32.41 | -3.92 | -4.01 | -4.35 | -2.05 | -9.35 | -9.35 | -9.35 | -9.35 | -9.35 |
| Tax Rate, % | 33.98 | 33.98 | 33.98 | 33.98 | 33.98 | 33.98 | 33.98 | 33.98 | 33.98 | 33.98 |
| EBITAT | 1,810.0 | 1,716.9 | 762.7 | -148.1 | -156.7 | 783.0 | 825.8 | 870.8 | 918.3 | 968.5 |
| Depreciation | ||||||||||
| Changes in Account Receivables | ||||||||||
| Changes in Inventories | ||||||||||
| Changes in Accounts Payable | ||||||||||
| Capital Expenditure | ||||||||||
| UFCF | -9,853.7 | -18,981.1 | -2,004.4 | 22,237.9 | 11,414.8 | -5,020.9 | 242.0 | 255.3 | 269.2 | 283.9 |
| WACC, % | 8.49 | 8.43 | 8.21 | 8.37 | 8.42 | 8.38 | 8.38 | 8.38 | 8.38 | 8.38 |
| PV UFCF | ||||||||||
| SUM PV UFCF | -3,841.1 | |||||||||
| Long Term Growth Rate, % | 2.00 | |||||||||
| Free cash flow (T + 1) | 290 | |||||||||
| Terminal Value | 4,536 | |||||||||
| Present Terminal Value | 3,033 | |||||||||
| Enterprise Value | -808 | |||||||||
| Net Debt | -1,798 | |||||||||
| Equity Value | 990 | |||||||||
| Diluted Shares Outstanding, MM | 6,386 | |||||||||
| Equity Value Per Share | 0.15 |
What You Will Receive
- Comprehensive Financial Model: Leverage Sealand Securities' actual data for accurate DCF valuation.
- Complete Forecasting Control: Easily modify revenue growth, profit margins, WACC, and other essential variables.
- Real-Time Calculations: Automatic adjustments allow you to see results instantly as you input changes.
- Professional-Grade Template: An expertly crafted Excel file tailored for robust valuation.
- Flexible and Reusable: Designed for adaptability, enabling you to conduct detailed forecasts repeatedly.
Key Features
- Comprehensive Historical Data: Access Sealand Securities Co., Ltd.'s (000750SZ) detailed financial statements and pre-filled projections.
- Customizable Parameters: Modify inputs such as WACC, tax rates, revenue growth, and EBITDA margins as needed.
- Real-Time Valuation: Observe the recalculation of Sealand Securities Co., Ltd.'s (000750SZ) intrinsic value live.
- Intuitive Visual Representations: Dashboard visuals showcase valuation outcomes and essential metrics.
- Designed for Precision: A reliable tool tailored for analysts, investors, and finance professionals.
How It Operates
- Step 1: Download the ready-to-use Excel template featuring Sealand Securities Co., Ltd.'s (000750SZ) data.
- Step 2: Navigate through the pre-filled sheets to familiarize yourself with the essential metrics.
- Step 3: Modify forecasts and assumptions in the editable yellow cells (WACC, growth, margins).
- Step 4: Instantly see the recalibrated results, including the intrinsic value of Sealand Securities Co., Ltd. (000750SZ).
- Step 5: Make well-informed investment choices or create reports based on the generated outputs.
Why Opt for Sealand Securities Co., Ltd. ([000750SZ])?
- Precision: Utilizes genuine Sealand financial data for unparalleled accuracy.
- Adaptability: Allows users to easily experiment with and adjust inputs.
- Efficiency: Eliminate the need to create a financial model from the ground up.
- High-Quality Standards: Crafted with the expertise and focus typical of top-tier financial institutions.
- Intuitive Interface: Designed to be accessible for users at all skill levels, even those new to financial modeling.
Who Should Utilize Sealand Securities Co., Ltd. (000750SZ)?
- Individual Investors: Gain the insights needed to make informed decisions regarding your investments in Sealand Securities (000750SZ).
- Financial Analysts: Enhance your analysis with comprehensive valuation models tailored for Sealand Securities (000750SZ).
- Consultants: Provide expert valuation assessments to clients with the data and tools specific to Sealand Securities (000750SZ).
- Business Owners: Learn about the valuation methods applied to companies like Sealand Securities (000750SZ) to inform your strategic decisions.
- Finance Students: Explore real-life valuation methodologies using Sealand Securities (000750SZ) as a case study.
What the Template Contains
- Preloaded Sealand Securities Data: Historical and projected financial metrics, including revenue, EBIT, and capital expenditures.
- DCF and WACC Models: Professional-grade spreadsheets for determining intrinsic value and Weighted Average Cost of Capital.
- Editable Inputs: Yellow-highlighted cells for modifying revenue growth rates, tax rates, and discount rates.
- Financial Statements: Detailed annual and quarterly financial reports for in-depth analysis.
- Key Ratios: Profitability, leverage, and efficiency ratios to assess company performance.
- Dashboard and Charts: Visual representations of valuation results and underlying assumptions.
Disclaimer
All information, articles, and product details provided on this website are for general informational and educational purposes only. We do not claim any ownership over, nor do we intend to infringe upon, any trademarks, copyrights, logos, brand names, or other intellectual property mentioned or depicted on this site. Such intellectual property remains the property of its respective owners, and any references here are made solely for identification or informational purposes, without implying any affiliation, endorsement, or partnership.
We make no representations or warranties, express or implied, regarding the accuracy, completeness, or suitability of any content or products presented. Nothing on this website should be construed as legal, tax, investment, financial, medical, or other professional advice. In addition, no part of this site—including articles or product references—constitutes a solicitation, recommendation, endorsement, advertisement, or offer to buy or sell any securities, franchises, or other financial instruments, particularly in jurisdictions where such activity would be unlawful.
All content is of a general nature and may not address the specific circumstances of any individual or entity. It is not a substitute for professional advice or services. Any actions you take based on the information provided here are strictly at your own risk. You accept full responsibility for any decisions or outcomes arising from your use of this website and agree to release us from any liability in connection with your use of, or reliance upon, the content or products found herein.