
|
DCF-Bewertung |
Fully Editable: Tailor To Your Needs In Excel Or Sheets
Professional Design: Trusted, Industry-Standard Templates
Investor-Approved Valuation Models
MAC/PC Compatible, Fully Unlocked
No Expertise Is Needed; Easy To Follow
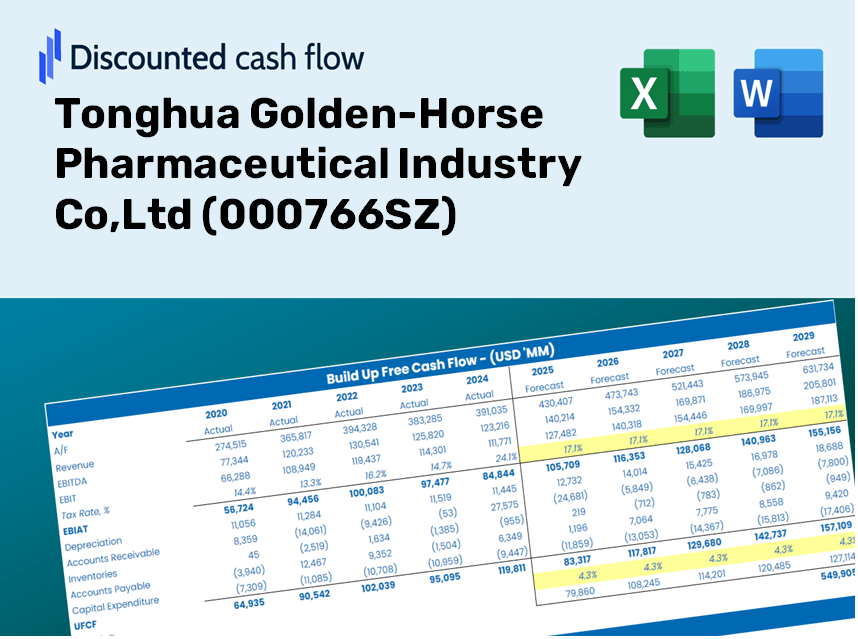
Tonghua Golden-Horse Pharmaceutical Industry Co,Ltd (000766.SZ) Bundle
Schalten Sie das finanzielle Potenzial von Tonghua Golden-P-PS-Pharmazeutische Industrie Co., Ltd. frei! Dieser DCF-Taschenrechner (000766SZ) ist mit vorgefüllten Finanzdaten ausgestattet und bietet Ihnen die Flexibilität, das Umsatzwachstum, WACC, Margen und andere kritische Annahmen zu ändern, um sich mit Ihren Prognosen auszurichten.
Discounted Cash Flow (DCF) - (USD MM)
| Year | AY1 2020 |
AY2 2021 |
AY3 2022 |
AY4 2023 |
AY5 2024 |
FY1 2025 |
FY2 2026 |
FY3 2027 |
FY4 2028 |
FY5 2029 |
|---|---|---|---|---|---|---|---|---|---|---|
| Revenue | 1,111.8 | 1,515.5 | 1,470.7 | 1,473.3 | 1,322.6 | 1,399.6 | 1,481.1 | 1,567.4 | 1,658.7 | 1,755.3 |
| Revenue Growth, % | 0 | 36.31 | -2.95 | 0.17654 | -10.23 | 5.82 | 5.82 | 5.82 | 5.82 | 5.82 |
| EBITDA | -278.5 | 182.7 | 192.6 | 196.5 | 204.8 | 81.0 | 85.7 | 90.7 | 95.9 | 101.5 |
| EBITDA, % | -25.05 | 12.06 | 13.09 | 13.34 | 15.49 | 5.78 | 5.78 | 5.78 | 5.78 | 5.78 |
| Depreciation | 67.7 | 69.4 | 71.6 | 74.7 | 64.4 | 71.3 | 75.5 | 79.9 | 84.5 | 89.5 |
| Depreciation, % | 6.09 | 4.58 | 4.87 | 5.07 | 4.87 | 5.1 | 5.1 | 5.1 | 5.1 | 5.1 |
| EBIT | -346.2 | 113.3 | 121.0 | 121.8 | 140.4 | 9.6 | 10.2 | 10.8 | 11.4 | 12.1 |
| EBIT, % | -31.14 | 7.48 | 8.22 | 8.26 | 10.62 | 0.68784 | 0.68784 | 0.68784 | 0.68784 | 0.68784 |
| Total Cash | 508.0 | 301.8 | 337.0 | 178.5 | 275.3 | 339.9 | 359.7 | 380.7 | 402.9 | 426.3 |
| Total Cash, percent | .0 | .0 | .0 | .0 | .0 | .0 | .0 | .0 | .0 | .0 |
| Account Receivables | 458.9 | 444.1 | 506.2 | 555.1 | 541.6 | 514.0 | 544.0 | 575.6 | 609.2 | 644.6 |
| Account Receivables, % | 41.28 | 29.31 | 34.42 | 37.68 | 40.95 | 36.73 | 36.73 | 36.73 | 36.73 | 36.73 |
| Inventories | 435.3 | 384.6 | 381.4 | 369.2 | 382.2 | 404.2 | 427.8 | 452.7 | 479.1 | 507.0 |
| Inventories, % | 39.15 | 25.38 | 25.93 | 25.06 | 28.9 | 28.88 | 28.88 | 28.88 | 28.88 | 28.88 |
| Accounts Payable | 187.9 | 150.6 | 221.8 | 191.0 | 182.3 | 192.2 | 203.4 | 215.3 | 227.8 | 241.1 |
| Accounts Payable, % | 16.9 | 9.94 | 15.08 | 12.96 | 13.79 | 13.73 | 13.73 | 13.73 | 13.73 | 13.73 |
| Capital Expenditure | -19.2 | -25.5 | -23.7 | -26.7 | -49.2 | -29.5 | -31.2 | -33.1 | -35.0 | -37.0 |
| Capital Expenditure, % | -1.72 | -1.68 | -1.61 | -1.81 | -3.72 | -2.11 | -2.11 | -2.11 | -2.11 | -2.11 |
| Tax Rate, % | 15.87 | 15.87 | 15.87 | 15.87 | 15.87 | 15.87 | 15.87 | 15.87 | 15.87 | 15.87 |
| EBITAT | -349.8 | 67.0 | 72.7 | 97.5 | 118.1 | 7.4 | 7.8 | 8.3 | 8.8 | 9.3 |
| Depreciation | ||||||||||
| Changes in Account Receivables | ||||||||||
| Changes in Inventories | ||||||||||
| Changes in Accounts Payable | ||||||||||
| Capital Expenditure | ||||||||||
| UFCF | -1,007.5 | 139.1 | 132.9 | 78.1 | 125.2 | 64.6 | 9.8 | 10.3 | 10.9 | 11.6 |
| WACC, % | 5.35 | 5.21 | 5.21 | 5.28 | 5.3 | 5.27 | 5.27 | 5.27 | 5.27 | 5.27 |
| PV UFCF | ||||||||||
| SUM PV UFCF | 96.9 | |||||||||
| Long Term Growth Rate, % | 4.00 | |||||||||
| Free cash flow (T + 1) | 12 | |||||||||
| Terminal Value | 947 | |||||||||
| Present Terminal Value | 732 | |||||||||
| Enterprise Value | 829 | |||||||||
| Net Debt | -77 | |||||||||
| Equity Value | 906 | |||||||||
| Diluted Shares Outstanding, MM | 941 | |||||||||
| Equity Value Per Share | 0.96 |
What You Will Receive
- Authentic Tonghua Data: Comprehensive financial metrics – from revenue to EBIT – grounded in actual and projected figures.
- Complete Customization: Modify all essential parameters (yellow cells) such as WACC, growth %, and tax rates.
- Immediate Valuation Updates: Automatic recalculations to assess the effect of changes on Tonghua Golden-Horse’s fair value.
- Dynamic Excel Template: Designed for quick modifications, scenario analysis, and in-depth forecasts.
- Efficient and Precise: Eliminate the need to build models from the ground up while ensuring accuracy and adaptability.
Key Features
- 🔍 Real-Life (000766SZ) Financials: Pre-filled historical and projected data for Tonghua Golden-Horse Pharmaceutical Industry Co., Ltd.
- ✏️ Fully Customizable Inputs: Adjust all critical parameters (yellow cells) like WACC, growth %, and tax rates.
- 📊 Professional DCF Valuation: Built-in formulas calculate Tonghua's intrinsic value using the Discounted Cash Flow method.
- ⚡ Instant Results: Visualize Tonghua's valuation instantly after making changes.
- Scenario Analysis: Test and compare outcomes for various financial assumptions side-by-side.
How It Works
- 1. Access the Template: Download and open the Excel file containing Tonghua Golden-Horse Pharmaceutical Industry Co., Ltd's preloaded data.
- 2. Adjust Assumptions: Modify essential inputs such as growth rates, WACC, and capital expenditures.
- 3. See Results in Real-Time: The DCF model automatically computes the intrinsic value and NPV.
- 4. Explore Scenarios: Evaluate various forecasts to investigate different valuation results.
- 5. Present with Assurance: Deliver professional valuation insights to bolster your decision-making process.
Why Opt for This Calculator?
- User-Friendly: Crafted for both novices and seasoned users.
- Customizable Inputs: Easily adjust parameters to suit your analysis.
- Real-Time Updates: Observe immediate changes to Tonghua Golden-Horse's valuation as you modify inputs.
- Pre-Installed Data: Comes with Tonghua Golden-Horse’s actual financial information for swift evaluations.
- Widely Recognized: Employed by investors and analysts for making well-informed choices.
Who Should Utilize This Product?
- Investors: Accurately assess the fair value of Tonghua Golden-Horse Pharmaceutical Industry Co., Ltd (000766SZ) before making investment choices.
- CFOs: Utilize a sophisticated DCF model for comprehensive financial reporting and analysis.
- Consultants: Easily modify the template for tailored valuation reports for your clients.
- Entrepreneurs: Acquire knowledge of financial modeling practices employed by leading pharmaceutical companies.
- Educators: Implement it as a resource to illustrate valuation techniques in the classroom.
What the Template Includes
- Operating and Balance Sheet Data: Pre-filled historical data and forecasts for Tonghua Golden-Horse Pharmaceutical Industry Co., Ltd (000766SZ), covering revenue, EBITDA, EBIT, and capital expenditures.
- WACC Calculation: A dedicated sheet for the Weighted Average Cost of Capital (WACC), featuring key parameters like Beta, risk-free rate, and share price.
- DCF Valuation (Unlevered and Levered): Customizable Discounted Cash Flow models demonstrating intrinsic value with comprehensive calculations.
- Financial Statements: Pre-loaded financial statements (annual and quarterly) to facilitate thorough analysis.
- Key Ratios: A collection of profitability, leverage, and efficiency ratios specific to Tonghua Golden-Horse Pharmaceutical Industry Co., Ltd (000766SZ).
- Dashboard and Charts: A visual summary of valuation outputs and assumptions, making it easy to analyze results.
Disclaimer
All information, articles, and product details provided on this website are for general informational and educational purposes only. We do not claim any ownership over, nor do we intend to infringe upon, any trademarks, copyrights, logos, brand names, or other intellectual property mentioned or depicted on this site. Such intellectual property remains the property of its respective owners, and any references here are made solely for identification or informational purposes, without implying any affiliation, endorsement, or partnership.
We make no representations or warranties, express or implied, regarding the accuracy, completeness, or suitability of any content or products presented. Nothing on this website should be construed as legal, tax, investment, financial, medical, or other professional advice. In addition, no part of this site—including articles or product references—constitutes a solicitation, recommendation, endorsement, advertisement, or offer to buy or sell any securities, franchises, or other financial instruments, particularly in jurisdictions where such activity would be unlawful.
All content is of a general nature and may not address the specific circumstances of any individual or entity. It is not a substitute for professional advice or services. Any actions you take based on the information provided here are strictly at your own risk. You accept full responsibility for any decisions or outcomes arising from your use of this website and agree to release us from any liability in connection with your use of, or reliance upon, the content or products found herein.