
|
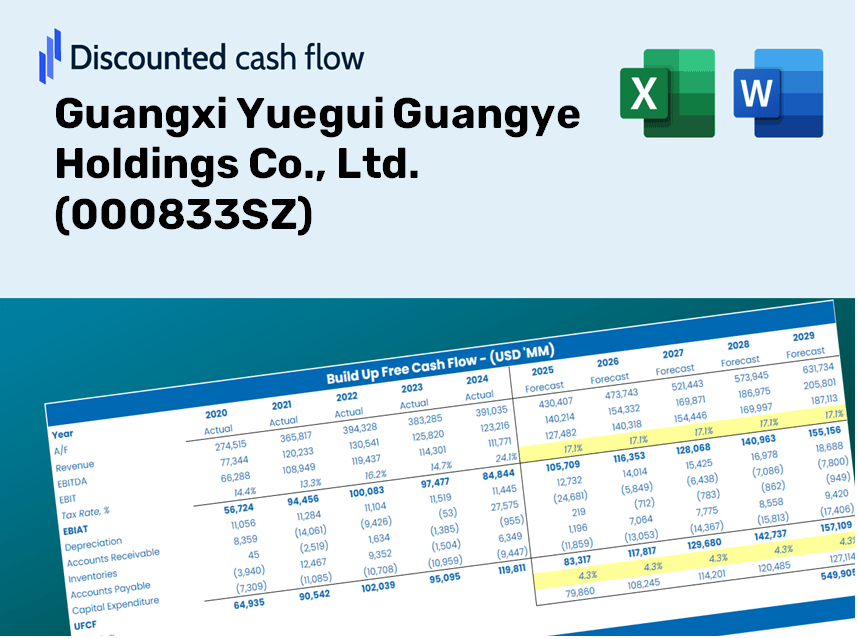
Guangxi Yuegui Guangye Holdings Co., Ltd. (000833.Sz) DCF -Bewertung |
Fully Editable: Tailor To Your Needs In Excel Or Sheets
Professional Design: Trusted, Industry-Standard Templates
Investor-Approved Valuation Models
MAC/PC Compatible, Fully Unlocked
No Expertise Is Needed; Easy To Follow
Guangxi Yuegui Guangye Holdings Co., Ltd. (000833.SZ) Bundle
Egal, ob Sie ein Investor oder Analyst sind, dieser DCF-Taschenrechner (000833SZ) ist Ihr Anlaufwerk für eine genaue Bewertung. Mit Guangxi Yuegui Guangye Holdings Co., Ltd. Real Data, können Sie Prognosen ändern und die Auswirkungen in Echtzeit beobachten.
What You Will Receive
- Genuine 000833SZ Financial Data: Pre-filled with Guangxi Yuegui Guangye Holdings' historical and anticipated figures for accurate analysis.
- Completely Customizable Template: Effortlessly adjust key inputs such as revenue growth, WACC, and EBITDA %.
- Instantaneous Calculations: Witness the intrinsic value of Guangxi Yuegui Guangye Holdings update in real-time as you modify inputs.
- Expert Valuation Tool: Tailored for investors, analysts, and consultants looking for precise DCF results.
- Intuitive Design: Structured simply with clear guidance, suitable for all levels of expertise.
Key Features
- Authentic Financial Data: Gain access to precise pre-loaded historical figures and future forecasts specific to Guangxi Yuegui Guangye Holdings Co., Ltd. (000833SZ).
- Adjustable Forecast Inputs: Modify highlighted fields such as WACC, growth rates, and profit margins to suit your analysis.
- Real-Time Calculations: Automatic updates for DCF, Net Present Value (NPV), and cash flow assessments.
- Interactive Dashboard: Clear and concise charts and summaries to help you visualize your valuation findings.
- Designed for All Skill Levels: An easy-to-navigate layout crafted for investors, CFOs, and consultants alike.
How It Works
- Step 1: Download the prebuilt Excel template featuring Guangxi Yuegui Guangye Holdings Co., Ltd.'s (000833SZ) data.
- Step 2: Review the pre-filled sheets to familiarize yourself with the key performance indicators.
- Step 3: Adjust forecasts and assumptions in the editable yellow cells (WACC, growth, margins).
- Step 4: Instantly see recalculated results, including the intrinsic value of Guangxi Yuegui Guangye Holdings Co., Ltd. (000833SZ).
- Step 5: Utilize the outputs to make well-informed investment decisions or generate comprehensive reports.
Why Choose Our Calculator for Guangxi Yuegui Guangye Holdings Co., Ltd. (000833SZ)?
- All-in-One Solution: Features DCF, WACC, and financial ratio analyses consolidated in one tool.
- Flexible Inputs: Modify yellow-highlighted cells to explore different scenarios effectively.
- In-Depth Analysis: Automatically computes the intrinsic value and Net Present Value for Guangxi Yuegui Guangye Holdings.
- Preloaded Historical Data: Access comprehensive historical and forecasted data for precise calculations.
- Designed for Professionals: Perfect for financial analysts, investors, and business consultants seeking detailed insights.
Who Can Benefit from Guangxi Yuegui Guangye Holdings Co., Ltd. (000833SZ)?
- Investors: Make informed choices with our comprehensive valuation tools tailored for the market.
- Financial Analysts: Streamline your analysis process with our customizable DCF model designed for efficiency.
- Consultants: Effortlessly modify our templates for impactful client presentations and reports.
- Finance Enthusiasts: Enhance your knowledge of valuation methods through practical, real-world applications.
- Educators and Students: Utilize our resources as a hands-on learning aid in finance courses.
What This Template Offers
- Comprehensive DCF Model: Fully editable template featuring detailed valuation calculations.
- Real-World Data: Historical and projected financials for Guangxi Yuegui Guangye Holdings Co., Ltd. (000833SZ) preloaded for your analysis.
- Customizable Parameters: Modify WACC, growth rates, and tax assumptions to explore various scenarios.
- Financial Statements: Complete annual and quarterly breakdowns for in-depth insights.
- Key Ratios: Integrated analysis for evaluating profitability, efficiency, and leverage.
- Dashboard with Visual Outputs: Charts and tables designed for clear and actionable results.
Disclaimer
All information, articles, and product details provided on this website are for general informational and educational purposes only. We do not claim any ownership over, nor do we intend to infringe upon, any trademarks, copyrights, logos, brand names, or other intellectual property mentioned or depicted on this site. Such intellectual property remains the property of its respective owners, and any references here are made solely for identification or informational purposes, without implying any affiliation, endorsement, or partnership.
We make no representations or warranties, express or implied, regarding the accuracy, completeness, or suitability of any content or products presented. Nothing on this website should be construed as legal, tax, investment, financial, medical, or other professional advice. In addition, no part of this site—including articles or product references—constitutes a solicitation, recommendation, endorsement, advertisement, or offer to buy or sell any securities, franchises, or other financial instruments, particularly in jurisdictions where such activity would be unlawful.
All content is of a general nature and may not address the specific circumstances of any individual or entity. It is not a substitute for professional advice or services. Any actions you take based on the information provided here are strictly at your own risk. You accept full responsibility for any decisions or outcomes arising from your use of this website and agree to release us from any liability in connection with your use of, or reliance upon, the content or products found herein.