
|
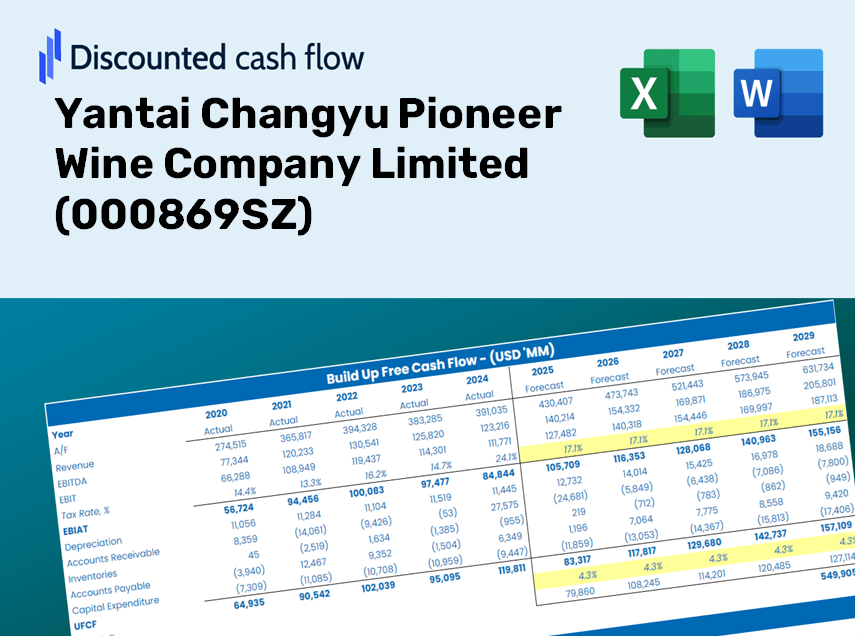
Yantai Changyu Pioneer Wine Company Limited (000869.SZ) DCF -Bewertung |
Fully Editable: Tailor To Your Needs In Excel Or Sheets
Professional Design: Trusted, Industry-Standard Templates
Investor-Approved Valuation Models
MAC/PC Compatible, Fully Unlocked
No Expertise Is Needed; Easy To Follow
Yantai Changyu Pioneer Wine Company Limited (000869.SZ) Bundle
Unser (000869SZ) DCF-Taschenrechner konzipiert für die Genauigkeit und ermöglicht es Ihnen, die Bewertung von Yantai Changyu Pioneer Wine Company Limited unter Verwendung realer Finanzdaten zu bewerten und vollständige Flexibilität zu bieten, um alle wesentlichen Parameter für verbesserte Projektionen zu ändern.
Benefits You Will Receive
- Authentic Yantai Changyu Financial Data: Pre-loaded with historical and projected figures for in-depth analysis.
- Completely Customizable Template: Easily adjust key variables such as revenue growth, WACC, and EBITDA percentage.
- Instant Calculations: Watch as the intrinsic value of Yantai Changyu updates in real-time with your modifications.
- Professional Valuation Tool: Tailored for investors, analysts, and consultants aiming for precise DCF outcomes.
- Intuitive Interface: User-friendly layout and straightforward guidelines suitable for all skill levels.
Key Features
- Pre-Loaded Data: Historical financial statements and pre-populated forecasts for Yantai Changyu Pioneer Wine Company Limited (000869SZ).
- Fully Adjustable Inputs: Customize WACC, tax rates, revenue growth, and EBITDA margins as needed.
- Instant Results: View the intrinsic value of Yantai Changyu Pioneer Wine Company Limited (000869SZ) recalculated in real time.
- Clear Visual Outputs: Dashboard charts present valuation results and essential metrics clearly.
- Built for Accuracy: A professional-grade tool designed for analysts, investors, and finance professionals.
How It Functions
- Step 1: Download the Excel file.
- Step 2: Examine the pre-filled data for Yantai Changyu Pioneer Wine Company Limited (000869SZ) (historical and projected).
- Step 3: Modify key assumptions (highlighted in yellow) according to your evaluation.
- Step 4: Observe the automatic updates calculating the intrinsic value of Yantai Changyu Pioneer Wine Company Limited (000869SZ).
- Step 5: Utilize the results for investment strategies or reporting purposes.
Why Choose This Calculator for Yantai Changyu Pioneer Wine Company Limited (000869SZ)?
- All-in-One Solution: Features DCF, WACC, and financial ratio analyses seamlessly integrated.
- Adjustable Parameters: Modify the highlighted cells to explore different scenarios.
- In-Depth Analysis: Automatically determines the intrinsic value and Net Present Value for Yantai Changyu.
- Preloaded Market Data: Historical and projected figures provide reliable benchmarks.
- High Standards: Perfectly suited for financial analysts, investors, and business strategists.
Who Can Benefit from Yantai Changyu Pioneer Wine Company Limited (000869SZ)?
- Investors: Make informed choices with a robust valuation tool tailored for the wine industry.
- Financial Analysts: Streamline your workflow with a customizable DCF model designed for wine market analysis.
- Consultants: Effortlessly modify the template for client briefings or reports specific to the wine sector.
- Wine Enthusiasts: Enhance your comprehension of valuation methods through real-life scenarios related to wine investments.
- Educators and Students: Utilize this resource as a hands-on learning aid in finance and wine industry courses.
Contents of the Template
- Historical Data: Features past financial performance and baseline projections for Yantai Changyu Pioneer Wine Company Limited (000869SZ).
- DCF and Levered DCF Models: Comprehensive templates designed to assess the intrinsic value of Yantai Changyu Pioneer Wine Company Limited (000869SZ).
- WACC Sheet: Pre-calculated sections for Weighted Average Cost of Capital (WACC).
- Editable Inputs: Customize essential drivers including growth rates, EBITDA percentages, and CAPEX assumptions.
- Quarterly and Annual Statements: A thorough analysis of the financial structure of Yantai Changyu Pioneer Wine Company Limited (000869SZ).
- Interactive Dashboard: Dynamically visualize valuation outcomes and forecasts.
Disclaimer
All information, articles, and product details provided on this website are for general informational and educational purposes only. We do not claim any ownership over, nor do we intend to infringe upon, any trademarks, copyrights, logos, brand names, or other intellectual property mentioned or depicted on this site. Such intellectual property remains the property of its respective owners, and any references here are made solely for identification or informational purposes, without implying any affiliation, endorsement, or partnership.
We make no representations or warranties, express or implied, regarding the accuracy, completeness, or suitability of any content or products presented. Nothing on this website should be construed as legal, tax, investment, financial, medical, or other professional advice. In addition, no part of this site—including articles or product references—constitutes a solicitation, recommendation, endorsement, advertisement, or offer to buy or sell any securities, franchises, or other financial instruments, particularly in jurisdictions where such activity would be unlawful.
All content is of a general nature and may not address the specific circumstances of any individual or entity. It is not a substitute for professional advice or services. Any actions you take based on the information provided here are strictly at your own risk. You accept full responsibility for any decisions or outcomes arising from your use of this website and agree to release us from any liability in connection with your use of, or reliance upon, the content or products found herein.