
|
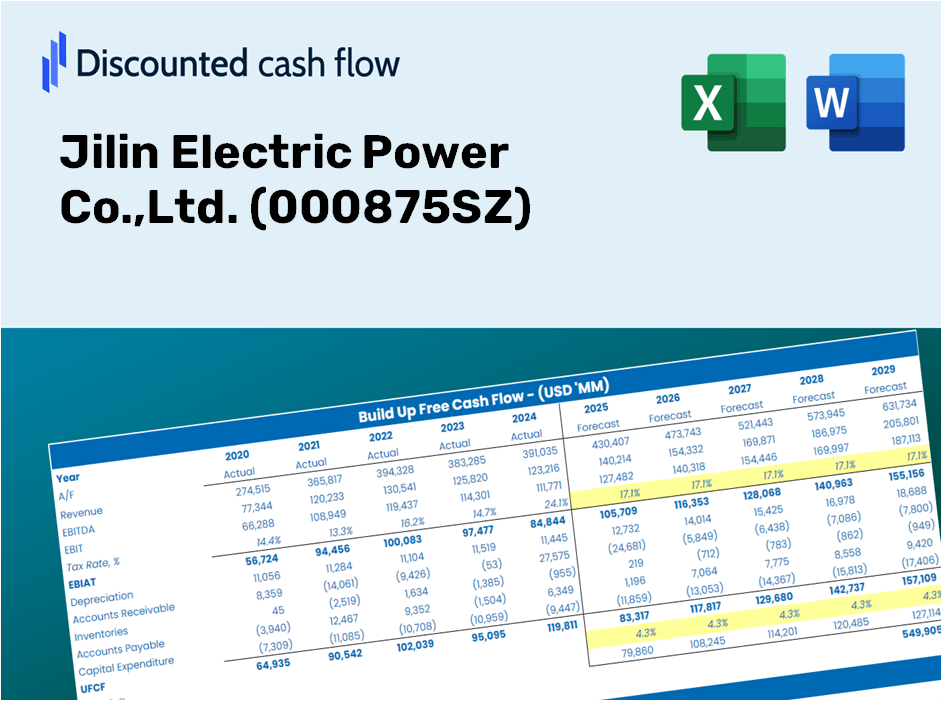
Jilin Electric Power Co., Ltd. (000875.SZ) DCF -Bewertung |
Fully Editable: Tailor To Your Needs In Excel Or Sheets
Professional Design: Trusted, Industry-Standard Templates
Investor-Approved Valuation Models
MAC/PC Compatible, Fully Unlocked
No Expertise Is Needed; Easy To Follow
Jilin Electric Power Co.,Ltd. (000875.SZ) Bundle
Bewerten Sie die finanziellen Aussichten von Jilin Electric Power Co., Ltd. wie ein Experte! Dieser DCF-Taschenrechner (000875SZ) liefert vorgefüllte Finanzdaten sowie die Flexibilität, das Umsatzwachstum, WACC, Margen und andere wesentliche Annahmen zu ändern, um sich an Ihren Projektionen anzupassen.
Discounted Cash Flow (DCF) - (USD MM)
| Year | AY1 2020 |
AY2 2021 |
AY3 2022 |
AY4 2023 |
AY5 2024 |
FY1 2025 |
FY2 2026 |
FY3 2027 |
FY4 2028 |
FY5 2029 |
|---|---|---|---|---|---|---|---|---|---|---|
| Revenue | 10,060.0 | 13,253.8 | 14,954.8 | 14,442.6 | 13,739.7 | 14,986.3 | 16,345.9 | 17,828.9 | 19,446.4 | 21,210.6 |
| Revenue Growth, % | 0 | 31.75 | 12.83 | -3.42 | -4.87 | 9.07 | 9.07 | 9.07 | 9.07 | 9.07 |
| EBITDA | 4,299.8 | 5,410.9 | 6,514.5 | 6,715.6 | 7,062.6 | 6,744.7 | 7,356.6 | 8,024.0 | 8,752.0 | 9,546.0 |
| EBITDA, % | 42.74 | 40.82 | 43.56 | 46.5 | 51.4 | 45.01 | 45.01 | 45.01 | 45.01 | 45.01 |
| Depreciation | 2,158.8 | 2,789.7 | 3,268.6 | 3,442.4 | 3,741.8 | 3,459.8 | 3,773.7 | 4,116.1 | 4,489.5 | 4,896.8 |
| Depreciation, % | 21.46 | 21.05 | 21.86 | 23.84 | 27.23 | 23.09 | 23.09 | 23.09 | 23.09 | 23.09 |
| EBIT | 2,141.0 | 2,621.2 | 3,245.9 | 3,273.2 | 3,320.8 | 3,284.9 | 3,582.9 | 3,907.9 | 4,262.5 | 4,649.2 |
| EBIT, % | 21.28 | 19.78 | 21.7 | 22.66 | 24.17 | 21.92 | 21.92 | 21.92 | 21.92 | 21.92 |
| Total Cash | 500.8 | 931.8 | 1,349.4 | 1,100.5 | 860.6 | 1,046.5 | 1,141.5 | 1,245.0 | 1,358.0 | 1,481.2 |
| Total Cash, percent | .0 | .0 | .0 | .0 | .0 | .0 | .0 | .0 | .0 | .0 |
| Account Receivables | 7,187.9 | 8,425.1 | 8,741.5 | 8,635.5 | 10,554.9 | 9,893.4 | 10,791.0 | 11,770.0 | 12,837.8 | 14,002.5 |
| Account Receivables, % | 71.45 | 63.57 | 58.45 | 59.79 | 76.82 | 66.02 | 66.02 | 66.02 | 66.02 | 66.02 |
| Inventories | 289.7 | 411.2 | 266.4 | 141.2 | 305.4 | 328.6 | 358.4 | 390.9 | 426.4 | 465.1 |
| Inventories, % | 2.88 | 3.1 | 1.78 | 0.97732 | 2.22 | 2.19 | 2.19 | 2.19 | 2.19 | 2.19 |
| Accounts Payable | 2,994.3 | 3,129.6 | 3,477.3 | 3,285.4 | 3,523.9 | 3,747.3 | 4,087.3 | 4,458.1 | 4,862.6 | 5,303.7 |
| Accounts Payable, % | 29.76 | 23.61 | 23.25 | 22.75 | 25.65 | 25.01 | 25.01 | 25.01 | 25.01 | 25.01 |
| Capital Expenditure | -10,572.3 | -7,076.9 | -6,692.1 | -6,785.4 | -6,893.1 | -8,850.8 | -9,653.7 | -10,529.6 | -11,484.9 | -12,526.8 |
| Capital Expenditure, % | -105.09 | -53.4 | -44.75 | -46.98 | -50.17 | -59.06 | -59.06 | -59.06 | -59.06 | -59.06 |
| Tax Rate, % | 44.98 | 44.98 | 44.98 | 44.98 | 44.98 | 44.98 | 44.98 | 44.98 | 44.98 | 44.98 |
| EBITAT | 1,044.7 | 1,249.7 | 1,538.2 | 1,566.5 | 1,826.9 | 1,621.0 | 1,768.0 | 1,928.5 | 2,103.4 | 2,294.2 |
| Depreciation | ||||||||||
| Changes in Account Receivables | ||||||||||
| Changes in Inventories | ||||||||||
| Changes in Accounts Payable | ||||||||||
| Capital Expenditure | ||||||||||
| UFCF | -11,852.1 | -4,260.9 | -1,709.2 | -1,737.0 | -3,169.5 | -2,908.2 | -4,699.4 | -5,125.7 | -5,590.8 | -6,098.0 |
| WACC, % | 3.21 | 3.18 | 3.17 | 3.18 | 3.37 | 3.22 | 3.22 | 3.22 | 3.22 | 3.22 |
| PV UFCF | ||||||||||
| SUM PV UFCF | -22,017.8 | |||||||||
| Long Term Growth Rate, % | 3.50 | |||||||||
| Free cash flow (T + 1) | -6,311 | |||||||||
| Terminal Value | 2,263,694 | |||||||||
| Present Terminal Value | 1,931,850 | |||||||||
| Enterprise Value | 1,909,833 | |||||||||
| Net Debt | 37,311 | |||||||||
| Equity Value | 1,872,522 | |||||||||
| Diluted Shares Outstanding, MM | 2,893 | |||||||||
| Equity Value Per Share | 647.32 |
What You Will Receive
- Customizable Excel Template: A fully adjustable Excel-based DCF Calculator featuring pre-populated financial data for Jilin Electric Power Co., Ltd. (000875SZ).
- Accurate Market Data: Historical performance metrics and future projections (highlighted in the yellow cells).
- Flexible Forecasting: Easily modify assumptions such as revenue growth, EBITDA percentage, and WACC.
- Instant Calculations: Quickly observe how your inputs affect the valuation of Jilin Electric Power Co., Ltd. (000875SZ).
- Professional-Grade Tool: Designed for investors, CFOs, consultants, and financial analysts.
- User-Friendly Layout: Organized for clarity and straightforward navigation, complete with step-by-step guidance.
Key Features
- 🔍 Real-Life Jilin Electric Power Financials: Pre-filled historical and projected data for Jilin Electric Power Co., Ltd. (000875SZ).
- ✏️ Fully Customizable Inputs: Adjust all essential parameters (yellow cells) such as WACC, growth %, and tax rates.
- 📊 Professional DCF Valuation: Built-in formulas calculate Jilin Electric Power’s intrinsic value using the Discounted Cash Flow method.
- ⚡ Instant Results: Visualize Jilin Electric Power’s valuation immediately after making adjustments.
- Scenario Analysis: Test and compare outcomes for different financial assumptions side-by-side.
How It Functions
- Download the Template: Gain instant access to the Excel-based Jilin Electric Power DCF Calculator.
- Input Your Assumptions: Modify the yellow-highlighted cells for growth rates, WACC, margins, and more.
- Instant Calculations: The model automatically calculates the intrinsic value of Jilin Electric Power.
- Test Scenarios: Experiment with various assumptions to assess potential changes in valuation.
- Analyze and Make Decisions: Utilize the results to inform your investment or financial analysis.
Why Opt for Jilin Electric Power Co., Ltd. Calculator?
- Reliable Data: Accurate financial information for Jilin Electric Power Co., Ltd. ensures dependable valuation outcomes.
- Flexible Options: Tailor essential parameters such as growth rates, WACC, and tax rates to fit your forecasts.
- Efficiency Boost: Pre-configured calculations save you the hassle of starting anew.
- Professional Tool: Crafted for investors, analysts, and consultants in the energy sector.
- Easy to Use: User-friendly interface and clear, step-by-step guidance make it accessible for everyone.
Who Can Benefit from This Product?
- Professional Investors: Develop comprehensive and accurate valuation models for investment analysis of Jilin Electric Power Co., Ltd. (000875SZ).
- Corporate Finance Teams: Evaluate valuation scenarios to inform internal decision-making and strategic direction.
- Consultants and Advisors: Deliver precise valuation insights regarding Jilin Electric Power Co., Ltd. (000875SZ) to clients.
- Students and Educators: Utilize real-time data to enhance skills in financial modeling and education.
- Energy Sector Enthusiasts: Gain insights into how utility companies like Jilin Electric Power Co., Ltd. (000875SZ) are evaluated within the market.
Contents of the Template
- Detailed DCF Model: An editable template featuring extensive valuation calculations.
- Real-World Data: Historical and projected financials for Jilin Electric Power Co., Ltd. (000875SZ) preloaded for your analysis.
- Customizable Parameters: Modify WACC, growth rates, and tax assumptions to explore different scenarios.
- Financial Statements: Comprehensive annual and quarterly financial breakdowns for enhanced insights.
- Key Ratios: Integrated analysis covering profitability, efficiency, and leverage metrics.
- Visual Dashboard: Charts and tables providing clear and actionable results.
Disclaimer
All information, articles, and product details provided on this website are for general informational and educational purposes only. We do not claim any ownership over, nor do we intend to infringe upon, any trademarks, copyrights, logos, brand names, or other intellectual property mentioned or depicted on this site. Such intellectual property remains the property of its respective owners, and any references here are made solely for identification or informational purposes, without implying any affiliation, endorsement, or partnership.
We make no representations or warranties, express or implied, regarding the accuracy, completeness, or suitability of any content or products presented. Nothing on this website should be construed as legal, tax, investment, financial, medical, or other professional advice. In addition, no part of this site—including articles or product references—constitutes a solicitation, recommendation, endorsement, advertisement, or offer to buy or sell any securities, franchises, or other financial instruments, particularly in jurisdictions where such activity would be unlawful.
All content is of a general nature and may not address the specific circumstances of any individual or entity. It is not a substitute for professional advice or services. Any actions you take based on the information provided here are strictly at your own risk. You accept full responsibility for any decisions or outcomes arising from your use of this website and agree to release us from any liability in connection with your use of, or reliance upon, the content or products found herein.