
|
Henan Shuanghui Investition & Development Co., Ltd. (000895.SZ) DCF -Bewertung |
Fully Editable: Tailor To Your Needs In Excel Or Sheets
Professional Design: Trusted, Industry-Standard Templates
Investor-Approved Valuation Models
MAC/PC Compatible, Fully Unlocked
No Expertise Is Needed; Easy To Follow
Henan Shuanghui Investment & Development Co.,Ltd. (000895.SZ) Bundle
Gewinnen Sie Einblicke in Ihre Henan Shuanghui -Investition & Development Co., Ltd. (000895SZ) Bewertungsanalyse unter Verwendung unseres modernen DCF-Taschenrechners! Diese Excel -Vorlage wird mit realen (000895SZ) Daten vorinstalliert, sodass Sie Prognosen und Annahmen anpassen können, um den intrinsischen Wert von Henan Shuanghui -Investition genau zu berechnen & Development Co., Ltd.
What You Will Receive
- Customizable Excel Template: A fully adaptable Excel-based DCF Calculator featuring pre-loaded financial data for Henan Shuanghui Investment & Development Co., Ltd. (000895SZ).
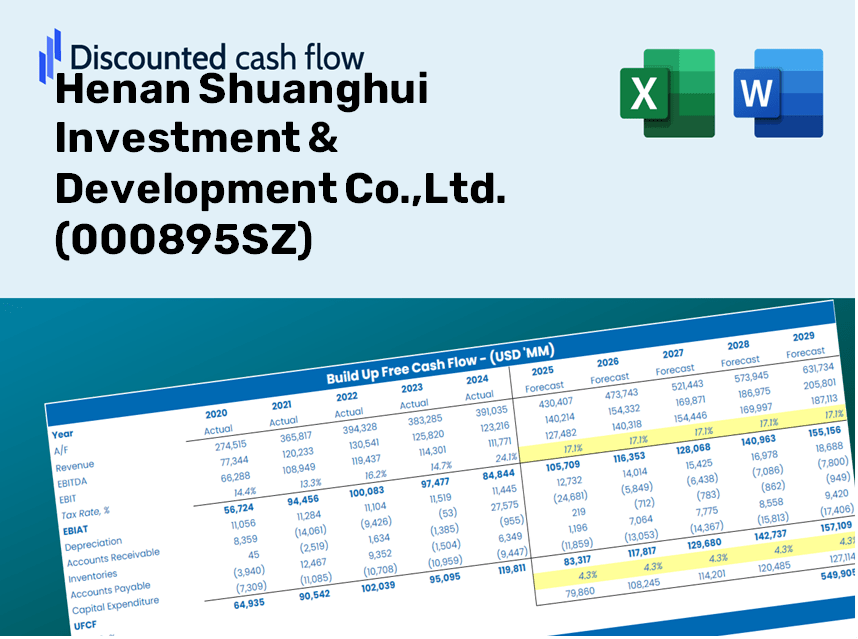
- Comprehensive Data: Historical performance metrics and forward-looking projections (highlighted in the yellow cells).
- Flexible Forecasting: Modify key assumptions such as revenue growth, EBITDA margin, and WACC.
- Instant Calculations: Quickly observe how your inputs affect the valuation of Henan Shuanghui Investment & Development Co., Ltd. (000895SZ).
- Professional-Grade Tool: Designed for investors, CFOs, consultants, and financial analysts.
- Intuitive Interface: Organized for easy understanding and navigation, complete with step-by-step guidance.
Key Features
- Customizable Forecast Inputs: Adjust essential parameters such as revenue growth, EBITDA percentage, and capital expenditures for tailored analysis.
- Instant DCF Valuation: Quickly computes intrinsic value, NPV, and a range of financial outputs.
- High-Precision Accuracy: Leverages Henan Shuanghui's actual financial data for reliable valuation results.
- Effortless Scenario Analysis: Easily explore various assumptions and compare the resulting outcomes.
- Efficiency Booster: Streamline your valuation process by avoiding the complexities of building models from the ground up.
How It Works
- Step 1: Download the Excel file.
- Step 2: Examine the pre-filled financial data and forecasts for Henan Shuanghui Investment & Development Co., Ltd. (000895SZ).
- Step 3: Adjust key inputs such as revenue growth, WACC, and tax rates (highlighted cells).
- Step 4: Observe the DCF model update in real-time as you modify your assumptions.
- Step 5: Evaluate the outputs and leverage the results for your investment decisions.
Why Choose This Calculator?
- Reliable Data: Access authentic financials from Henan Shuanghui Investment & Development Co., Ltd. for trustworthy valuation insights.
- Fully Customizable: Tailor critical inputs like growth rates, WACC, and tax rates to align with your forecasts.
- Efficiency Boost: Pre-configured calculations save you the hassle of starting from scratch.
- Professional-Quality Tool: Created for investors, analysts, and financial consultants.
- User-Friendly Interface: An intuitive design and clear step-by-step guidance make it accessible for everyone.
Who Should Use This Product?
- Investors: Confidently assess Henan Shuanghui Investment & Development Co., Ltd.’s (000895SZ) fair value prior to making investment choices.
- CFOs: Utilize a top-tier DCF model for comprehensive financial reporting and analysis.
- Consultants: Efficiently customize the template for client valuation reports.
- Entrepreneurs: Discover financial modeling techniques employed by leading industry players.
- Educators: Implement it as an educational resource to illustrate various valuation methodologies.
Contents of the Template
- Historical Data: Features Shuanghui’s past financial performance and foundational forecasts.
- DCF and Levered DCF Models: Comprehensive templates to assess Shuanghui’s intrinsic value.
- WACC Sheet: Pre-configured calculations for the Weighted Average Cost of Capital.
- Editable Inputs: Customize essential drivers such as growth rates, EBITDA margins, and CAPEX assumptions.
- Quarterly and Annual Statements: A thorough analysis of Shuanghui’s financial documents.
- Interactive Dashboard: Dynamic visualization of valuation results and forecasts.
Disclaimer
All information, articles, and product details provided on this website are for general informational and educational purposes only. We do not claim any ownership over, nor do we intend to infringe upon, any trademarks, copyrights, logos, brand names, or other intellectual property mentioned or depicted on this site. Such intellectual property remains the property of its respective owners, and any references here are made solely for identification or informational purposes, without implying any affiliation, endorsement, or partnership.
We make no representations or warranties, express or implied, regarding the accuracy, completeness, or suitability of any content or products presented. Nothing on this website should be construed as legal, tax, investment, financial, medical, or other professional advice. In addition, no part of this site—including articles or product references—constitutes a solicitation, recommendation, endorsement, advertisement, or offer to buy or sell any securities, franchises, or other financial instruments, particularly in jurisdictions where such activity would be unlawful.
All content is of a general nature and may not address the specific circumstances of any individual or entity. It is not a substitute for professional advice or services. Any actions you take based on the information provided here are strictly at your own risk. You accept full responsibility for any decisions or outcomes arising from your use of this website and agree to release us from any liability in connection with your use of, or reliance upon, the content or products found herein.