
|
Hunan Valin Steel Co., Ltd. (000932.Sz) DCF -Bewertung |
Fully Editable: Tailor To Your Needs In Excel Or Sheets
Professional Design: Trusted, Industry-Standard Templates
Investor-Approved Valuation Models
MAC/PC Compatible, Fully Unlocked
No Expertise Is Needed; Easy To Follow
Hunan Valin Steel Co., Ltd. (000932.SZ) Bundle
Stürzen Sie Ihre Analyse und verbessern Sie die Präzision mit unserem DCF -Taschenrechner (000932SZ)! Mit realen Daten von Hunan Valin Steel Co., Ltd. und anpassbaren Annahmen ermöglichen dieses Tool Sie, den Wert von Hunan Valin Steel wie einen erfahrenen Investor zu prognostizieren, zu analysieren und zu bewerten.
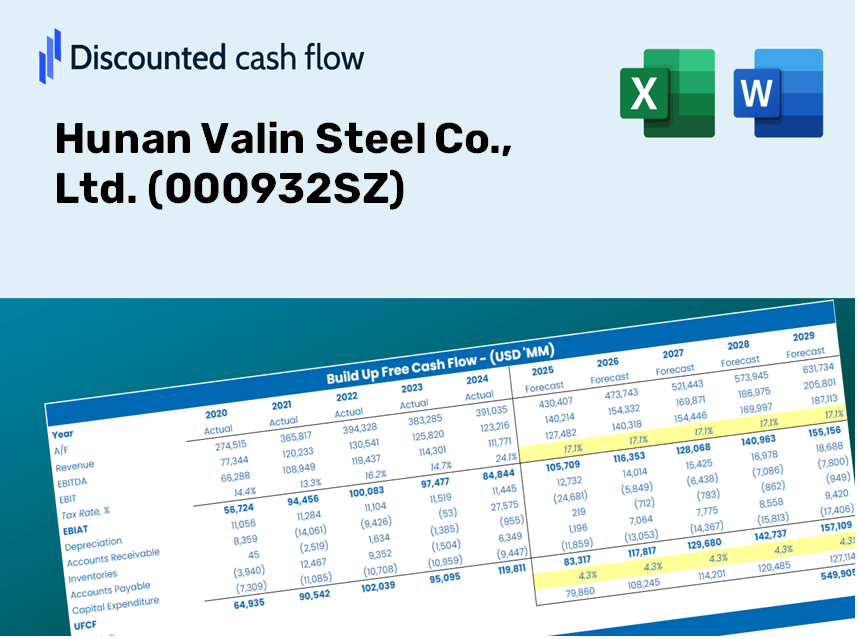
Discounted Cash Flow (DCF) - (USD MM)
| Year | AY1 2020 |
AY2 2021 |
AY3 2022 |
AY4 2023 |
AY5 2024 |
FY1 2025 |
FY2 2026 |
FY3 2027 |
FY4 2028 |
FY5 2029 |
|---|---|---|---|---|---|---|---|---|---|---|
| Revenue | 116,528.0 | 171,575.1 | 168,636.7 | 164,465.3 | 144,684.7 | 147,764.1 | 150,909.0 | 154,120.8 | 157,401.0 | 160,751.1 |
| Revenue Growth, % | 0 | 47.24 | -1.71 | -2.47 | -12.03 | 2.13 | 2.13 | 2.13 | 2.13 | 2.13 |
| EBITDA | 11,989.6 | 15,355.5 | 11,949.5 | 11,004.8 | 7,676.4 | 11,325.1 | 11,566.1 | 11,812.3 | 12,063.7 | 12,320.5 |
| EBITDA, % | 10.29 | 8.95 | 7.09 | 6.69 | 5.31 | 7.66 | 7.66 | 7.66 | 7.66 | 7.66 |
| Depreciation | 3,319.4 | 3,224.2 | 3,376.0 | 3,842.2 | 3,989.5 | 3,494.1 | 3,568.5 | 3,644.4 | 3,722.0 | 3,801.2 |
| Depreciation, % | 2.85 | 1.88 | 2 | 2.34 | 2.76 | 2.36 | 2.36 | 2.36 | 2.36 | 2.36 |
| EBIT | 8,670.2 | 12,131.3 | 8,573.5 | 7,162.6 | 3,686.9 | 7,831.0 | 7,997.7 | 8,167.9 | 8,341.7 | 8,519.3 |
| EBIT, % | 7.44 | 7.07 | 5.08 | 4.36 | 2.55 | 5.3 | 5.3 | 5.3 | 5.3 | 5.3 |
| Total Cash | 8,997.9 | 10,087.8 | 12,617.3 | 26,709.8 | 13,448.0 | 13,777.0 | 14,070.2 | 14,369.7 | 14,675.5 | 14,987.9 |
| Total Cash, percent | .0 | .0 | .0 | .0 | .0 | .0 | .0 | .0 | .0 | .0 |
| Account Receivables | 12,679.7 | 24,240.8 | 14,758.3 | 20,830.0 | 10,987.7 | 15,964.6 | 16,304.4 | 16,651.4 | 17,005.8 | 17,367.8 |
| Account Receivables, % | 10.88 | 14.13 | 8.75 | 12.67 | 7.59 | 10.8 | 10.8 | 10.8 | 10.8 | 10.8 |
| Inventories | 10,604.6 | 11,366.0 | 12,262.4 | 14,553.7 | 12,019.7 | 11,866.4 | 12,118.9 | 12,376.9 | 12,640.3 | 12,909.3 |
| Inventories, % | 9.1 | 6.62 | 7.27 | 8.85 | 8.31 | 8.03 | 8.03 | 8.03 | 8.03 | 8.03 |
| Accounts Payable | 15,758.3 | 10,821.2 | 26,415.5 | 26,307.3 | 36,391.7 | 22,650.0 | 23,132.0 | 23,624.4 | 24,127.2 | 24,640.7 |
| Accounts Payable, % | 13.52 | 6.31 | 15.66 | 16 | 25.15 | 15.33 | 15.33 | 15.33 | 15.33 | 15.33 |
| Capital Expenditure | -4,261.9 | -4,564.7 | -6,095.8 | -6,209.5 | -4,725.9 | -5,016.5 | -5,123.2 | -5,232.3 | -5,343.6 | -5,457.4 |
| Capital Expenditure, % | -3.66 | -2.66 | -3.61 | -3.78 | -3.27 | -3.39 | -3.39 | -3.39 | -3.39 | -3.39 |
| Tax Rate, % | 50.94 | 50.94 | 50.94 | 50.94 | 50.94 | 50.94 | 50.94 | 50.94 | 50.94 | 50.94 |
| EBITAT | 6,903.5 | 9,831.3 | 6,305.2 | 4,858.8 | 1,808.8 | 5,499.0 | 5,616.0 | 5,735.5 | 5,857.6 | 5,982.3 |
| Depreciation | ||||||||||
| Changes in Account Receivables | ||||||||||
| Changes in Inventories | ||||||||||
| Changes in Accounts Payable | ||||||||||
| Capital Expenditure | ||||||||||
| UFCF | -1,565.0 | -8,768.8 | 27,765.8 | -5,979.7 | 23,533.0 | -14,588.7 | 3,951.0 | 4,035.1 | 4,120.9 | 4,208.6 |
| WACC, % | 4.55 | 4.56 | 4.47 | 4.4 | 4.18 | 4.43 | 4.43 | 4.43 | 4.43 | 4.43 |
| PV UFCF | ||||||||||
| SUM PV UFCF | 49.0 | |||||||||
| Long Term Growth Rate, % | 0.50 | |||||||||
| Free cash flow (T + 1) | 4,230 | |||||||||
| Terminal Value | 107,580 | |||||||||
| Present Terminal Value | 86,611 | |||||||||
| Enterprise Value | 86,660 | |||||||||
| Net Debt | 9,654 | |||||||||
| Equity Value | 77,006 | |||||||||
| Diluted Shares Outstanding, MM | 6,909 | |||||||||
| Equity Value Per Share | 11.15 |
Benefits You Will Receive
- Genuine Hunan Valin Financials: Provides both historical and projected data for precise valuation.
- Customizable Parameters: Adjust WACC, tax rates, revenue growth, and capital expenditures to fit your analysis.
- Real-time Calculations: Intrinsic value and NPV are updated instantaneously.
- Comprehensive Scenario Analysis: Explore various scenarios to assess Hunan Valin Steel's future prospects.
- User-friendly Interface: Designed for industry professionals but easy to navigate for newcomers.
Core Features
- Authentic Hunan Valin Financials: Gain access to precise historical data and future forecasts that are pre-loaded.
- Flexible Forecast Inputs: Modify highlighted cells such as WACC, growth rates, and profit margins.
- Real-Time Calculations: Enjoy automatic updates for DCF, Net Present Value (NPV), and cash flow assessments.
- User-Friendly Dashboard: Utilize clear charts and summaries to effectively visualize your valuation outcomes.
- Designed for All Levels: A straightforward, intuitive layout suitable for investors, CFOs, and consultants alike.
How It Functions
- Download the Template: Gain immediate access to the Excel-based Hunan Valin Steel DCF Calculator.
- Enter Your Assumptions: Modify the yellow-highlighted cells for growth rates, WACC, profit margins, and other variables.
- Instant Calculations: The model automatically recalculates Hunan Valin Steel's intrinsic value.
- Explore Different Scenarios: Test various assumptions to assess potential changes in valuation.
- Assess and Decide: Leverage the results to inform your investment or financial strategies.
Why Choose This Calculator for Hunan Valin Steel Co., Ltd. (000932SZ)?
- All-in-One Solution: Integrates DCF, WACC, and financial ratio analysis into a single platform.
- Flexible Input Options: Modify the highlighted cells to explore different financial scenarios.
- In-Depth Analysis: Automatically computes Hunan Valin's intrinsic value and Net Present Value.
- Preloaded Information: Features historical and projected data for reliable analysis.
- Expert-Level Tool: Perfect for financial analysts, investors, and business advisors.
Who Can Benefit from This Product?
- Investors: Accurately assess Hunan Valin Steel's fair value before making investment choices.
- CFOs: Utilize a high-quality DCF model for comprehensive financial reporting and analysis.
- Consultants: Easily customize the template for client valuation reports.
- Entrepreneurs: Discover financial modeling techniques employed by leading companies in the steel industry.
- Educators: Implement it as a resource to illustrate valuation methodologies in the classroom.
Contents of the Template
- Preloaded Hunan Valin Steel Data: Historical and projected financial metrics, including revenue, EBIT, and capital expenditures.
- DCF and WACC Models: Professional-quality sheets designed for calculating intrinsic value and Weighted Average Cost of Capital.
- Editable Inputs: Yellow-highlighted cells for modifying revenue growth, tax rates, and discount rates.
- Financial Statements: Detailed annual and quarterly financial reports for in-depth analysis.
- Key Ratios: Ratios focusing on profitability, leverage, and efficiency to assess performance.
- Dashboard and Charts: Visual representations of valuation results and underlying assumptions.
Disclaimer
All information, articles, and product details provided on this website are for general informational and educational purposes only. We do not claim any ownership over, nor do we intend to infringe upon, any trademarks, copyrights, logos, brand names, or other intellectual property mentioned or depicted on this site. Such intellectual property remains the property of its respective owners, and any references here are made solely for identification or informational purposes, without implying any affiliation, endorsement, or partnership.
We make no representations or warranties, express or implied, regarding the accuracy, completeness, or suitability of any content or products presented. Nothing on this website should be construed as legal, tax, investment, financial, medical, or other professional advice. In addition, no part of this site—including articles or product references—constitutes a solicitation, recommendation, endorsement, advertisement, or offer to buy or sell any securities, franchises, or other financial instruments, particularly in jurisdictions where such activity would be unlawful.
All content is of a general nature and may not address the specific circumstances of any individual or entity. It is not a substitute for professional advice or services. Any actions you take based on the information provided here are strictly at your own risk. You accept full responsibility for any decisions or outcomes arising from your use of this website and agree to release us from any liability in connection with your use of, or reliance upon, the content or products found herein.