
|
Yunnan Nantian Electronics Information Co., Ltd. (000948.sz) DCF -Bewertung |
Fully Editable: Tailor To Your Needs In Excel Or Sheets
Professional Design: Trusted, Industry-Standard Templates
Investor-Approved Valuation Models
MAC/PC Compatible, Fully Unlocked
No Expertise Is Needed; Easy To Follow
Yunnan Nantian Electronics Information Co.,Ltd. (000948.SZ) Bundle
Bewerten Sie die finanziellen Aussichten von Yunnan Nantian Electronics Information Co., Ltd. wie ein Experte! Dieser DCF-Taschenrechner (000948SZ) bietet vorgefüllte Finanzdaten sowie umfassende Flexibilität, um das Umsatzwachstum, WACC, Margen und andere wichtige Annahmen zu ändern, um sich an Ihren Projektionen auszurichten.
Discounted Cash Flow (DCF) - (USD MM)
| Year | AY1 2020 |
AY2 2021 |
AY3 2022 |
AY4 2023 |
AY5 2024 |
FY1 2025 |
FY2 2026 |
FY3 2027 |
FY4 2028 |
FY5 2029 |
|---|---|---|---|---|---|---|---|---|---|---|
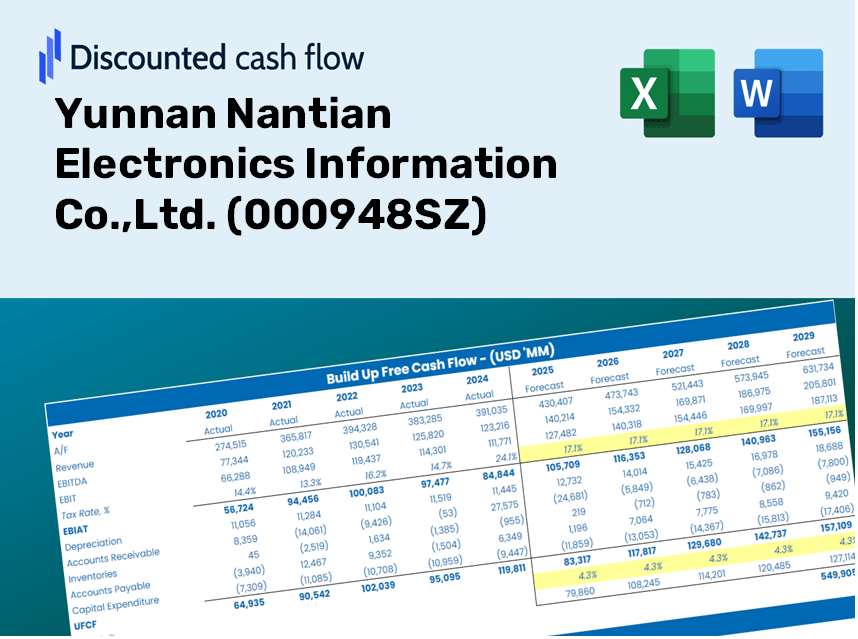
| Revenue | 4,239.4 | 5,632.2 | 8,567.0 | 9,137.6 | 9,450.8 | 11,696.4 | 14,475.8 | 17,915.5 | 22,172.5 | 27,441.2 |
| Revenue Growth, % | 0 | 32.85 | 52.11 | 6.66 | 3.43 | 23.76 | 23.76 | 23.76 | 23.76 | 23.76 |
| EBITDA | 194.2 | 178.9 | 251.0 | 207.5 | 274.9 | 371.1 | 459.3 | 568.5 | 703.6 | 870.7 |
| EBITDA, % | 4.58 | 3.18 | 2.93 | 2.27 | 2.91 | 3.17 | 3.17 | 3.17 | 3.17 | 3.17 |
| Depreciation | 45.1 | 50.3 | 69.4 | 82.6 | 85.4 | 107.0 | 132.4 | 163.9 | 202.8 | 251.0 |
| Depreciation, % | 1.06 | 0.89291 | 0.80955 | 0.90402 | 0.90338 | 0.91461 | 0.91461 | 0.91461 | 0.91461 | 0.91461 |
| EBIT | 149.1 | 128.6 | 181.6 | 124.9 | 189.5 | 264.2 | 326.9 | 404.6 | 500.8 | 619.7 |
| EBIT, % | 3.52 | 2.28 | 2.12 | 1.37 | 2.01 | 2.26 | 2.26 | 2.26 | 2.26 | 2.26 |
| Total Cash | 1,660.7 | 1,996.5 | 2,487.0 | 2,587.9 | 2,914.3 | 3,808.6 | 4,713.6 | 5,833.6 | 7,219.8 | 8,935.3 |
| Total Cash, percent | .0 | .0 | .0 | .0 | .0 | .0 | .0 | .0 | .0 | .0 |
| Account Receivables | 806.0 | 1,348.1 | 2,072.1 | 2,514.0 | 2,566.7 | 2,849.4 | 3,526.4 | 4,364.4 | 5,401.5 | 6,685.0 |
| Account Receivables, % | 19.01 | 23.94 | 24.19 | 27.51 | 27.16 | 24.36 | 24.36 | 24.36 | 24.36 | 24.36 |
| Inventories | 1,489.1 | 2,428.4 | 3,979.2 | 3,490.9 | 3,533.7 | 4,685.2 | 5,798.5 | 7,176.3 | 8,881.6 | 10,992.0 |
| Inventories, % | 35.12 | 43.12 | 46.45 | 38.2 | 37.39 | 40.06 | 40.06 | 40.06 | 40.06 | 40.06 |
| Accounts Payable | 627.4 | 886.5 | 1,355.9 | 1,412.7 | 3,657.9 | 2,351.7 | 2,910.5 | 3,602.1 | 4,458.0 | 5,517.3 |
| Accounts Payable, % | 14.8 | 15.74 | 15.83 | 15.46 | 38.7 | 20.11 | 20.11 | 20.11 | 20.11 | 20.11 |
| Capital Expenditure | -46.6 | -120.9 | -139.5 | -14.0 | -37.3 | -126.8 | -156.9 | -194.2 | -240.4 | -297.5 |
| Capital Expenditure, % | -1.1 | -2.15 | -1.63 | -0.15288 | -0.3948 | -1.08 | -1.08 | -1.08 | -1.08 | -1.08 |
| Tax Rate, % | 9.16 | 9.16 | 9.16 | 9.16 | 9.16 | 9.16 | 9.16 | 9.16 | 9.16 | 9.16 |
| EBITAT | 97.9 | 89.6 | 160.2 | 110.1 | 172.1 | 212.7 | 263.2 | 325.8 | 403.2 | 499.0 |
| Depreciation | ||||||||||
| Changes in Account Receivables | ||||||||||
| Changes in Inventories | ||||||||||
| Changes in Accounts Payable | ||||||||||
| Capital Expenditure | ||||||||||
| UFCF | -1,571.3 | -1,203.4 | -1,715.3 | 282.1 | 2,370.0 | -2,547.6 | -992.9 | -1,228.8 | -1,520.8 | -1,882.2 |
| WACC, % | 4.51 | 4.54 | 4.66 | 4.66 | 4.68 | 4.61 | 4.61 | 4.61 | 4.61 | 4.61 |
| PV UFCF | ||||||||||
| SUM PV UFCF | -7,187.9 | |||||||||
| Long Term Growth Rate, % | 2.00 | |||||||||
| Free cash flow (T + 1) | -1,920 | |||||||||
| Terminal Value | -73,484 | |||||||||
| Present Terminal Value | -58,651 | |||||||||
| Enterprise Value | -65,839 | |||||||||
| Net Debt | -2,115 | |||||||||
| Equity Value | -63,725 | |||||||||
| Diluted Shares Outstanding, MM | 394 | |||||||||
| Equity Value Per Share | -161.75 |
What You Will Receive
- Accurate Yunnan Nantian Financial Data: Pre-loaded with historical and projected figures for thorough analysis of (000948SZ).
- Customizable Template: Easily adjust essential inputs like revenue growth, WACC, and EBITDA percentage.
- Instant Calculation Updates: Track the intrinsic value of (000948SZ) as it refreshes automatically with your modifications.
- Professional Valuation Software: Tailored for investors, analysts, and consultants aiming for reliable DCF outcomes.
- User-Friendly Interface: Designed with a straightforward layout and clear guidance suitable for all skill levels.
Key Features
- Comprehensive Historical Data: Yunnan Nantian Electronics’ past financial statements and pre-filled projections.
- Customizable Variables: Adjust WACC, tax rates, revenue growth, and EBITDA margins as needed.
- Real-Time Calculations: View the intrinsic value of Yunnan Nantian Electronics instantly update.
- Visual Representation: Dashboard visuals showcase valuation findings and essential metrics.
- Designed for Precision: A professional-grade tool tailored for analysts, investors, and finance professionals.
How It Works
- 1. Access the Template: Download and open the Excel file containing Yunnan Nantian Electronics Information Co.,Ltd.’s preloaded data.
- 2. Modify Assumptions: Adjust key variables such as growth rates, WACC, and capital expenditures as needed.
- 3. Instant Results: The DCF model automatically computes intrinsic value and NPV in real-time.
- 4. Explore Scenarios: Compare various forecasts to evaluate different valuation outcomes.
- 5. Present with Assurance: Share professional valuation insights to back your strategic decisions.
Why Opt for This Calculator?
- User-Friendly Interface: Perfect for both novices and seasoned professionals.
- Customizable Inputs: Easily adjust parameters to suit your analysis needs.
- Real-Time Updates: Monitor immediate changes to Yunnan Nantian Electronics' valuation as you modify inputs.
- Pre-Configured: Comes with Yunnan Nantian Electronics' actual financial data for swift evaluations.
- Relied Upon by Experts: Frequently utilized by investors and analysts for informed decision-making.
Who Should Use This Product?
- Individual Investors: Make informed decisions regarding the purchase or sale of Yunnan Nantian Electronics Information Co., Ltd. (000948SZ) stock.
- Financial Analysts: Enhance valuation processes with ready-to-implement financial models tailored for Yunnan Nantian Electronics Information Co., Ltd. (000948SZ).
- Consultants: Provide clients with timely and accurate valuation insights for Yunnan Nantian Electronics Information Co., Ltd. (000948SZ).
- Business Owners: Gain understanding of how large corporations like Yunnan Nantian Electronics Information Co., Ltd. (000948SZ) are valued to inform your own business strategy.
- Finance Students: Explore valuation techniques using real-world data and case studies from Yunnan Nantian Electronics Information Co., Ltd. (000948SZ).
What the Template Contains
- Historical Data: Includes Yunnan Nantian Electronics' past financials and baseline forecasts.
- DCF and Levered DCF Models: Comprehensive templates to determine Yunnan Nantian Electronics' intrinsic value.
- WACC Sheet: Pre-built calculations for Weighted Average Cost of Capital.
- Editable Inputs: Adjust key drivers such as growth rates, EBITDA %, and CAPEX assumptions.
- Quarterly and Annual Statements: A detailed overview of Yunnan Nantian Electronics' financials.
- Interactive Dashboard: Dynamically visualize valuation results and projections.
Disclaimer
All information, articles, and product details provided on this website are for general informational and educational purposes only. We do not claim any ownership over, nor do we intend to infringe upon, any trademarks, copyrights, logos, brand names, or other intellectual property mentioned or depicted on this site. Such intellectual property remains the property of its respective owners, and any references here are made solely for identification or informational purposes, without implying any affiliation, endorsement, or partnership.
We make no representations or warranties, express or implied, regarding the accuracy, completeness, or suitability of any content or products presented. Nothing on this website should be construed as legal, tax, investment, financial, medical, or other professional advice. In addition, no part of this site—including articles or product references—constitutes a solicitation, recommendation, endorsement, advertisement, or offer to buy or sell any securities, franchises, or other financial instruments, particularly in jurisdictions where such activity would be unlawful.
All content is of a general nature and may not address the specific circumstances of any individual or entity. It is not a substitute for professional advice or services. Any actions you take based on the information provided here are strictly at your own risk. You accept full responsibility for any decisions or outcomes arising from your use of this website and agree to release us from any liability in connection with your use of, or reliance upon, the content or products found herein.