
|
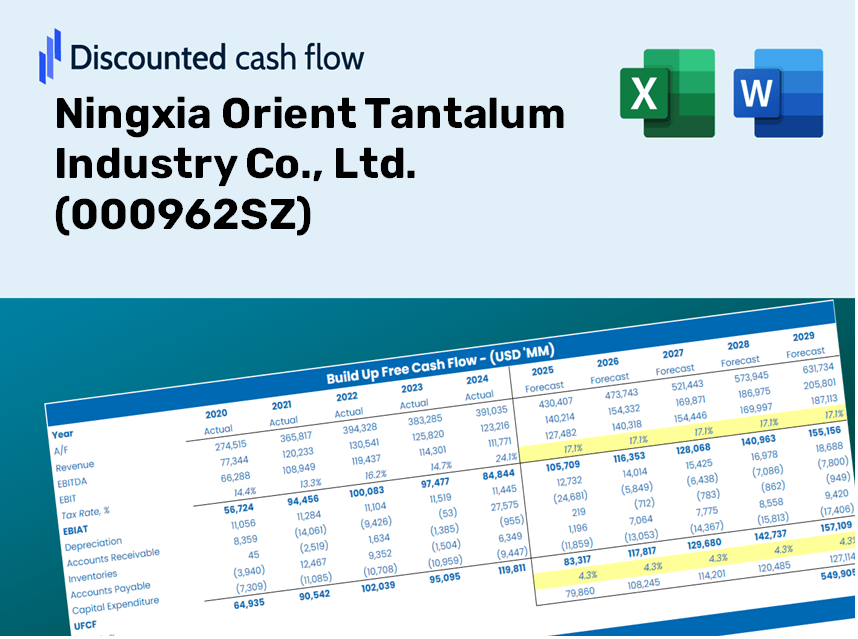
Ningxia Orient Tantalum Industry Co., Ltd. (000962.Sz) DCF -Bewertung |
Fully Editable: Tailor To Your Needs In Excel Or Sheets
Professional Design: Trusted, Industry-Standard Templates
Investor-Approved Valuation Models
MAC/PC Compatible, Fully Unlocked
No Expertise Is Needed; Easy To Follow
Ningxia Orient Tantalum Industry Co., Ltd. (000962.SZ) Bundle
Möchten Sie den inneren Wert von Ningxia orientiert Tantal Industry Co., Ltd., bestimmen? Unser (000962SZ) DCF-Taschenrechner integriert reale Daten mit umfangreichen Anpassungsfunktionen, mit denen Sie Ihre Prognosen verfeinern und Ihre Investitionsauswahl verbessern können.
Discounted Cash Flow (DCF) - (USD MM)
| Year | AY1 2020 |
AY2 2021 |
AY3 2022 |
AY4 2023 |
AY5 2024 |
FY1 2025 |
FY2 2026 |
FY3 2027 |
FY4 2028 |
FY5 2029 |
|---|---|---|---|---|---|---|---|---|---|---|
| Revenue | 676.4 | 794.7 | 986.2 | 1,108.1 | 1,280.6 | 1,503.1 | 1,764.3 | 2,070.9 | 2,430.8 | 2,853.2 |
| Revenue Growth, % | 0 | 17.49 | 24.09 | 12.35 | 15.57 | 17.38 | 17.38 | 17.38 | 17.38 | 17.38 |
| EBITDA | 69.4 | 83.2 | 92.6 | 122.1 | 168.6 | 163.2 | 191.6 | 224.9 | 264.0 | 309.8 |
| EBITDA, % | 10.25 | 10.47 | 9.39 | 11.02 | 13.17 | 10.86 | 10.86 | 10.86 | 10.86 | 10.86 |
| Depreciation | 56.3 | 50.7 | 52.4 | 40.2 | 41.1 | 80.7 | 94.8 | 111.2 | 130.5 | 153.2 |
| Depreciation, % | 8.33 | 6.38 | 5.31 | 3.63 | 3.21 | 5.37 | 5.37 | 5.37 | 5.37 | 5.37 |
| EBIT | 13.0 | 32.5 | 40.3 | 81.9 | 127.5 | 82.5 | 96.8 | 113.7 | 133.4 | 156.6 |
| EBIT, % | 1.93 | 4.09 | 4.08 | 7.39 | 9.96 | 5.49 | 5.49 | 5.49 | 5.49 | 5.49 |
| Total Cash | 101.7 | 114.0 | 249.2 | 793.4 | 502.7 | 497.5 | 584.0 | 685.4 | 804.6 | 944.4 |
| Total Cash, percent | .0 | .0 | .0 | .0 | .0 | .0 | .0 | .0 | .0 | .0 |
| Account Receivables | 196.8 | 184.9 | 292.1 | 340.7 | 525.3 | 462.2 | 542.5 | 636.8 | 747.4 | 877.3 |
| Account Receivables, % | 29.09 | 23.27 | 29.62 | 30.75 | 41.02 | 30.75 | 30.75 | 30.75 | 30.75 | 30.75 |
| Inventories | 287.3 | 365.8 | 421.8 | 441.1 | 498.3 | 631.3 | 741.0 | 869.7 | 1,020.9 | 1,198.2 |
| Inventories, % | 42.47 | 46.02 | 42.76 | 39.81 | 38.91 | 42 | 42 | 42 | 42 | 42 |
| Accounts Payable | 77.0 | 107.3 | 135.1 | 245.8 | 109.2 | 208.3 | 244.5 | 287.0 | 336.8 | 395.4 |
| Accounts Payable, % | 11.38 | 13.5 | 13.69 | 22.18 | 8.53 | 13.86 | 13.86 | 13.86 | 13.86 | 13.86 |
| Capital Expenditure | -1.6 | -1.0 | -54.7 | -133.4 | -218.6 | -105.3 | -123.6 | -145.0 | -170.2 | -199.8 |
| Capital Expenditure, % | -0.24066 | -0.12269 | -5.55 | -12.04 | -17.07 | -7 | -7 | -7 | -7 | -7 |
| Tax Rate, % | 1.05 | 1.05 | 1.05 | 1.05 | 1.05 | 1.05 | 1.05 | 1.05 | 1.05 | 1.05 |
| EBITAT | 13.0 | 32.1 | 39.8 | 79.9 | 126.2 | 81.5 | 95.7 | 112.3 | 131.8 | 154.7 |
| Depreciation | ||||||||||
| Changes in Account Receivables | ||||||||||
| Changes in Inventories | ||||||||||
| Changes in Accounts Payable | ||||||||||
| Capital Expenditure | ||||||||||
| UFCF | -339.4 | 45.5 | -98.0 | 29.4 | -429.6 | 86.1 | -87.0 | -102.1 | -119.8 | -140.6 |
| WACC, % | 6.82 | 6.82 | 6.82 | 6.82 | 6.82 | 6.82 | 6.82 | 6.82 | 6.82 | 6.82 |
| PV UFCF | ||||||||||
| SUM PV UFCF | -272.4 | |||||||||
| Long Term Growth Rate, % | 3.00 | |||||||||
| Free cash flow (T + 1) | -145 | |||||||||
| Terminal Value | -3,787 | |||||||||
| Present Terminal Value | -2,723 | |||||||||
| Enterprise Value | -2,995 | |||||||||
| Net Debt | -503 | |||||||||
| Equity Value | -2,492 | |||||||||
| Diluted Shares Outstanding, MM | 500 | |||||||||
| Equity Value Per Share | -4.98 |
Benefits You Will Receive
- Accurate NIT Financials: Access to both historical and projected data for precise valuation.
- Customizable Inputs: Adjust parameters such as WACC, tax rates, revenue growth, and capital expenditures.
- Automated Calculations: Intrinsic value and NPV calculations are performed in real-time.
- Scenario Analysis: Explore various scenarios to assess the future performance of Ningxia Orient Tantalum Industry Co., Ltd. (000962SZ).
- User-Friendly Interface: Designed for industry professionals while remaining approachable for newcomers.
Key Features
- 🔍 Real-Life [Symbol] Financials: Pre-populated historical and projected data for Ningxia Orient Tantalum Industry Co., Ltd. (000962SZ).
- ✏️ Fully Customizable Inputs: Modify all essential parameters (yellow cells) such as WACC, growth %, and tax rates.
- 📊 Professional DCF Valuation: Integrated formulas compute the intrinsic value of Ningxia Orient Tantalum using the Discounted Cash Flow method.
- ⚡ Instant Results: Immediately visualize Ningxia Orient Tantalum's valuation after any adjustments.
- Scenario Analysis: Evaluate and contrast results for different financial assumptions side-by-side.
How It Works
- 1. Access the Template: Download and open the Excel file containing Ningxia Orient Tantalum Industry Co., Ltd.'s (000962SZ) preloaded data.
- 2. Modify Assumptions: Adjust key inputs such as growth rates, WACC, and capital expenditures to reflect your analysis.
- 3. View Results Instantly: The DCF model automatically calculates intrinsic value and NPV for your inputs.
- 4. Explore Different Scenarios: Analyze various forecasts to assess different valuation outcomes effectively.
- 5. Present with Assurance: Use the professional valuation insights to back your decisions confidently.
Why Choose This Calculator for Ningxia Orient Tantalum Industry Co., Ltd. (000962SZ)?
- Designed for Industry Experts: A sophisticated tool tailored for analysts, CFOs, and industry consultants.
- Comprehensive Data: Historical and projected financials for Ningxia preloaded to ensure precision.
- Flexible Scenario Analysis: Effortlessly test various forecasts and assumptions.
- Insightful Outputs: Automatically computes intrinsic value, NPV, and essential financial metrics.
- User-Friendly: Detailed step-by-step guidance simplifies your experience.
Who Should Use This Product?
- Individual Investors: Make informed decisions regarding the purchase or sale of Ningxia Orient Tantalum Industry Co., Ltd. (000962SZ) stock.
- Financial Analysts: Enhance valuation practices with readily available financial models tailored for Ningxia Orient Tantalum Industry Co., Ltd. (000962SZ).
- Consultants: Provide clients with precise and timely valuation insights related to Ningxia Orient Tantalum Industry Co., Ltd. (000962SZ).
- Business Owners: Gain insights into how companies like Ningxia Orient Tantalum Industry Co., Ltd. (000962SZ) are valued to inform your own business strategy.
- Finance Students: Master valuation techniques using real-world data and case studies, including those from Ningxia Orient Tantalum Industry Co., Ltd. (000962SZ).
Contents of the Template
- Operating and Balance Sheet Data: Pre-populated historical data and forecasts for Ningxia Orient Tantalum Industry Co., Ltd. (000962SZ), covering revenue, EBITDA, EBIT, and capital expenditures.
- WACC Calculation: A specific sheet dedicated to the Weighted Average Cost of Capital (WACC), featuring parameters such as Beta, risk-free rate, and share price.
- DCF Valuation (Unlevered and Levered): Customizable Discounted Cash Flow models illustrating intrinsic value along with comprehensive calculations.
- Financial Statements: Pre-loaded annual and quarterly financial statements to facilitate in-depth analysis.
- Key Ratios: Includes ratios related to profitability, leverage, and efficiency for Ningxia Orient Tantalum Industry Co., Ltd. (000962SZ).
- Dashboard and Charts: A visual overview of valuation outputs and assumptions to make result analysis straightforward.
Disclaimer
All information, articles, and product details provided on this website are for general informational and educational purposes only. We do not claim any ownership over, nor do we intend to infringe upon, any trademarks, copyrights, logos, brand names, or other intellectual property mentioned or depicted on this site. Such intellectual property remains the property of its respective owners, and any references here are made solely for identification or informational purposes, without implying any affiliation, endorsement, or partnership.
We make no representations or warranties, express or implied, regarding the accuracy, completeness, or suitability of any content or products presented. Nothing on this website should be construed as legal, tax, investment, financial, medical, or other professional advice. In addition, no part of this site—including articles or product references—constitutes a solicitation, recommendation, endorsement, advertisement, or offer to buy or sell any securities, franchises, or other financial instruments, particularly in jurisdictions where such activity would be unlawful.
All content is of a general nature and may not address the specific circumstances of any individual or entity. It is not a substitute for professional advice or services. Any actions you take based on the information provided here are strictly at your own risk. You accept full responsibility for any decisions or outcomes arising from your use of this website and agree to release us from any liability in connection with your use of, or reliance upon, the content or products found herein.