
|
China Resources Sanjiu Medical & Pharmaceutical Co., Ltd. (000999.sz) DCF -Bewertung |
Fully Editable: Tailor To Your Needs In Excel Or Sheets
Professional Design: Trusted, Industry-Standard Templates
Investor-Approved Valuation Models
MAC/PC Compatible, Fully Unlocked
No Expertise Is Needed; Easy To Follow
China Resources Sanjiu Medical & Pharmaceutical Co., Ltd. (000999.SZ) Bundle
Suchen Sie, um den inneren Wert von China Resources Sanjiu Medical zu bewerten & Pharmaceutical Co., Ltd.? Unser (000999SZ) DCF-Taschenrechner integriert reale Daten mit umfangreichen Anpassungsoptionen, mit der Sie Prognosen anpassen und Ihre Anlagestrategien verbessern können.
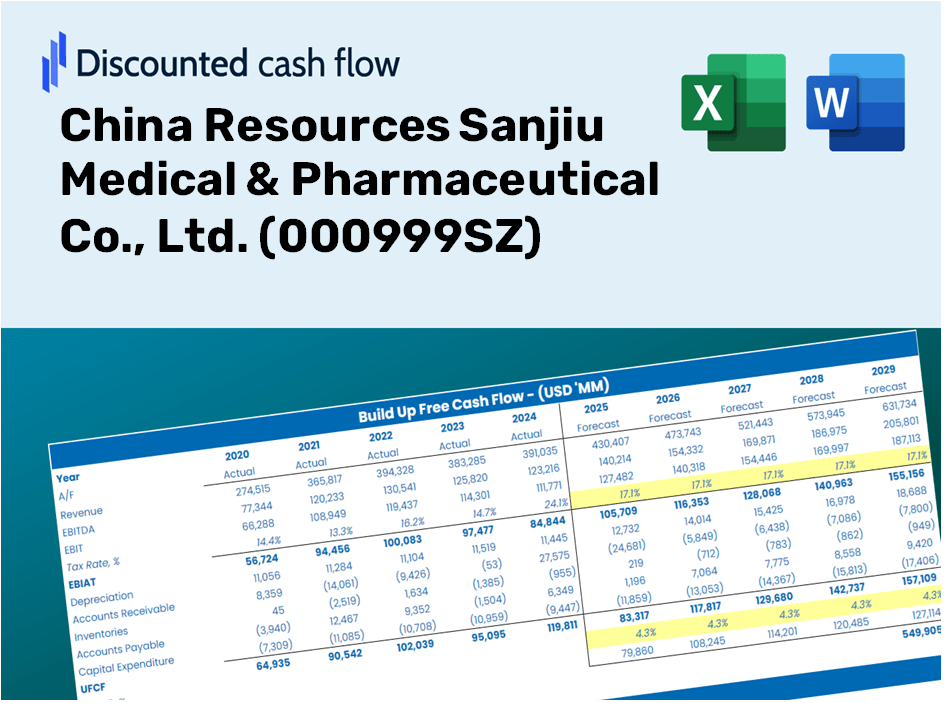
Discounted Cash Flow (DCF) - (USD MM)
| Year | AY1 2020 |
AY2 2021 |
AY3 2022 |
AY4 2023 |
AY5 2024 |
FY1 2025 |
FY2 2026 |
FY3 2027 |
FY4 2028 |
FY5 2029 |
|---|---|---|---|---|---|---|---|---|---|---|
| Revenue | 13,637.3 | 15,544.4 | 18,079.5 | 24,739.0 | 27,616.6 | 33,054.3 | 39,562.7 | 47,352.6 | 56,676.3 | 67,835.9 |
| Revenue Growth, % | 0 | 13.98 | 16.31 | 36.83 | 11.63 | 19.69 | 19.69 | 19.69 | 19.69 | 19.69 |
| EBITDA | 2,282.2 | 2,642.9 | 3,250.8 | 4,228.5 | 4,828.6 | 5,704.8 | 6,828.1 | 8,172.6 | 9,781.8 | 11,707.8 |
| EBITDA, % | 16.74 | 17 | 17.98 | 17.09 | 17.48 | 17.26 | 17.26 | 17.26 | 17.26 | 17.26 |
| Depreciation | 390.2 | 429.2 | 467.2 | 685.7 | 638.1 | 878.5 | 1,051.4 | 1,258.5 | 1,506.3 | 1,802.8 |
| Depreciation, % | 2.86 | 2.76 | 2.58 | 2.77 | 2.31 | 2.66 | 2.66 | 2.66 | 2.66 | 2.66 |
| EBIT | 1,892.0 | 2,213.7 | 2,783.7 | 3,542.8 | 4,190.6 | 4,826.4 | 5,776.7 | 6,914.1 | 8,275.5 | 9,905.0 |
| EBIT, % | 13.87 | 14.24 | 15.4 | 14.32 | 15.17 | 14.6 | 14.6 | 14.6 | 14.6 | 14.6 |
| Total Cash | 4,022.4 | 4,283.9 | 3,149.7 | 8,226.8 | 6,694.2 | 8,724.4 | 10,442.2 | 12,498.3 | 14,959.2 | 17,904.6 |
| Total Cash, percent | .0 | .0 | .0 | .0 | .0 | .0 | .0 | .0 | .0 | .0 |
| Account Receivables | 4,806.8 | 3,980.4 | 5,643.9 | 8,581.2 | 9,199.0 | 10,581.9 | 12,665.5 | 15,159.3 | 18,144.2 | 21,716.8 |
| Account Receivables, % | 35.25 | 25.61 | 31.22 | 34.69 | 33.31 | 32.01 | 32.01 | 32.01 | 32.01 | 32.01 |
| Inventories | 1,761.6 | 2,308.5 | 2,498.9 | 5,112.5 | 4,932.7 | 5,296.4 | 6,339.3 | 7,587.5 | 9,081.5 | 10,869.6 |
| Inventories, % | 12.92 | 14.85 | 13.82 | 20.67 | 17.86 | 16.02 | 16.02 | 16.02 | 16.02 | 16.02 |
| Accounts Payable | 1,117.6 | 1,499.1 | 1,449.5 | 3,097.3 | 3,148.8 | 3,290.8 | 3,938.7 | 4,714.3 | 5,642.5 | 6,753.5 |
| Accounts Payable, % | 8.2 | 9.64 | 8.02 | 12.52 | 11.4 | 9.96 | 9.96 | 9.96 | 9.96 | 9.96 |
| Capital Expenditure | -621.8 | -870.8 | -951.6 | -857.2 | -790.1 | -1,437.9 | -1,721.0 | -2,059.9 | -2,465.5 | -2,951.0 |
| Capital Expenditure, % | -4.56 | -5.6 | -5.26 | -3.47 | -2.86 | -4.35 | -4.35 | -4.35 | -4.35 | -4.35 |
| Tax Rate, % | 26.68 | 26.68 | 26.68 | 26.68 | 26.68 | 26.68 | 26.68 | 26.68 | 26.68 | 26.68 |
| EBITAT | 1,467.6 | 1,861.5 | 2,300.2 | 2,692.1 | 3,072.4 | 3,799.3 | 4,547.4 | 5,442.7 | 6,514.4 | 7,797.1 |
| Depreciation | ||||||||||
| Changes in Account Receivables | ||||||||||
| Changes in Inventories | ||||||||||
| Changes in Accounts Payable | ||||||||||
| Capital Expenditure | ||||||||||
| UFCF | -4,214.8 | 2,080.9 | -87.7 | -1,382.5 | 2,533.9 | 1,635.2 | 1,399.3 | 1,674.8 | 2,004.6 | 2,399.2 |
| WACC, % | 4.69 | 4.7 | 4.7 | 4.68 | 4.68 | 4.69 | 4.69 | 4.69 | 4.69 | 4.69 |
| PV UFCF | ||||||||||
| SUM PV UFCF | 7,874.9 | |||||||||
| Long Term Growth Rate, % | 3.00 | |||||||||
| Free cash flow (T + 1) | 2,471 | |||||||||
| Terminal Value | 146,203 | |||||||||
| Present Terminal Value | 116,258 | |||||||||
| Enterprise Value | 124,133 | |||||||||
| Net Debt | -3,891 | |||||||||
| Equity Value | 128,025 | |||||||||
| Diluted Shares Outstanding, MM | 1,281 | |||||||||
| Equity Value Per Share | 99.98 |
What You Will Receive
- Customizable Forecast Inputs: Effortlessly adjust assumptions (growth %, margins, WACC) to explore various scenarios.
- Real-Time Data: China Resources Sanjiu Medical & Pharmaceutical Co., Ltd.'s financial data pre-loaded to facilitate your analysis.
- Automated DCF Outputs: The template computes the Net Present Value (NPV) and intrinsic value automatically.
- Professional and Adaptable: A sophisticated Excel model designed to meet your valuation needs.
- Designed for Analysts and Investors: Perfect for evaluating projections, confirming strategies, and enhancing efficiency.
Key Features
- Comprehensive DCF Analysis Tool: Features both unlevered and levered DCF valuation models tailored for China Resources Sanjiu Medical & Pharmaceutical Co., Ltd. (000999SZ).
- WACC Computation Tool: Customizable Weighted Average Cost of Capital worksheet with pre-defined inputs.
- Modifiable Financial Projections: Update growth rates, capital expenditures, and discount rates as needed.
- Integrated Financial Ratios: Evaluate profitability, leverage, and efficiency metrics specific to China Resources Sanjiu Medical & Pharmaceutical Co., Ltd. (000999SZ).
- Interactive Dashboard and Charts: Visual representations that summarize essential valuation metrics for streamlined analysis.
How It Works
- Step 1: Download the Excel file for China Resources Sanjiu Medical & Pharmaceutical Co., Ltd. (000999SZ).
- Step 2: Review the pre-filled financial data and forecasts provided for China Resources Sanjiu Medical & Pharmaceutical Co., Ltd. (000999SZ).
- Step 3: Adjust key inputs such as revenue growth, WACC, and tax rates (highlighted cells).
- Step 4: Observe the DCF model updating in real-time as you modify your assumptions.
- Step 5: Evaluate the outputs and leverage the results to inform your investment decisions regarding China Resources Sanjiu Medical & Pharmaceutical Co., Ltd. (000999SZ).
Reasons to Choose China Resources Sanjiu Medical & Pharmaceutical Co., Ltd. (000999SZ)
- Time Efficient: Skip the complexities of building a financial model from the ground up – our solutions are ready for immediate use.
- Enhanced Accuracy: Dependable financial data and robust formulas minimize valuation errors.
- Completely Customizable: Adjust the model to fit your unique assumptions and forecasts.
- User-Friendly: Intuitive charts and outputs simplify the analysis of results.
- Endorsed by Professionals: Crafted for experts who prioritize precision and ease of use.
Who Should Benefit from This Product?
- Professional Investors: Develop comprehensive and trustworthy valuation models for portfolio evaluations related to China Resources Sanjiu Medical & Pharmaceutical Co., Ltd. (000999SZ).
- Corporate Finance Teams: Examine valuation scenarios to inform and direct internal business strategies.
- Consultants and Advisors: Offer clients precise valuation insights regarding China Resources Sanjiu Medical & Pharmaceutical Co., Ltd. (000999SZ).
- Students and Educators: Utilize real-world data to enhance financial modeling practices and teachings.
- Health Sector Enthusiasts: Gain insights into how companies like China Resources Sanjiu Medical & Pharmaceutical Co., Ltd. (000999SZ) are assessed within the market.
Contents of the Template
- Pre-Filled Data: Contains historical financials and projections for China Resources Sanjiu Medical & Pharmaceutical Co., Ltd. (000999SZ).
- Discounted Cash Flow Model: An editable DCF valuation model equipped with automatic calculations.
- Weighted Average Cost of Capital (WACC): A specific sheet designed for calculating WACC using custom inputs.
- Key Financial Ratios: Assess the profitability, efficiency, and leverage of China Resources Sanjiu Medical & Pharmaceutical Co., Ltd. (000999SZ).
- Customizable Inputs: Easily modify revenue growth rates, profit margins, and tax rates.
- Clear Dashboard: Visual representations and tables summarizing essential valuation outcomes.
Disclaimer
All information, articles, and product details provided on this website are for general informational and educational purposes only. We do not claim any ownership over, nor do we intend to infringe upon, any trademarks, copyrights, logos, brand names, or other intellectual property mentioned or depicted on this site. Such intellectual property remains the property of its respective owners, and any references here are made solely for identification or informational purposes, without implying any affiliation, endorsement, or partnership.
We make no representations or warranties, express or implied, regarding the accuracy, completeness, or suitability of any content or products presented. Nothing on this website should be construed as legal, tax, investment, financial, medical, or other professional advice. In addition, no part of this site—including articles or product references—constitutes a solicitation, recommendation, endorsement, advertisement, or offer to buy or sell any securities, franchises, or other financial instruments, particularly in jurisdictions where such activity would be unlawful.
All content is of a general nature and may not address the specific circumstances of any individual or entity. It is not a substitute for professional advice or services. Any actions you take based on the information provided here are strictly at your own risk. You accept full responsibility for any decisions or outcomes arising from your use of this website and agree to release us from any liability in connection with your use of, or reliance upon, the content or products found herein.