
|
Hunan Valin Draht & Cable Co., Ltd. (001208.sz) DCF -Bewertung |
Fully Editable: Tailor To Your Needs In Excel Or Sheets
Professional Design: Trusted, Industry-Standard Templates
Investor-Approved Valuation Models
MAC/PC Compatible, Fully Unlocked
No Expertise Is Needed; Easy To Follow
Hunan Valin Wire & Cable Co.,Ltd. (001208.SZ) Bundle
Unabhängig davon, ob Sie ein Investor oder Analyst sind, ist dieser DCF -Taschenrechner (001208SZ) Ihre wesentliche Ressource für eine genaue Bewertung. Mit Daten von Hunan Valin Draht vorinstalliert & Cable Co., Ltd., Sie können Prognosen anpassen und die Auswirkungen sofort beobachten.
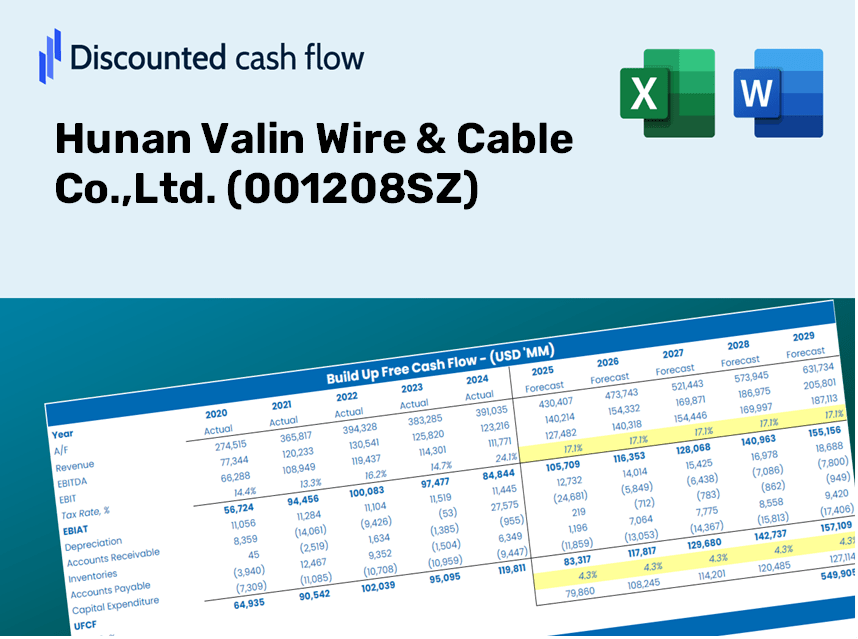
Discounted Cash Flow (DCF) - (USD MM)
| Year | AY1 2020 |
AY2 2021 |
AY3 2022 |
AY4 2023 |
AY5 2024 |
FY1 2025 |
FY2 2026 |
FY3 2027 |
FY4 2028 |
FY5 2029 |
|---|---|---|---|---|---|---|---|---|---|---|
| Revenue | 1,698.4 | 2,543.2 | 3,015.3 | 3,470.1 | 4,157.9 | 5,230.8 | 6,580.5 | 8,278.4 | 10,414.4 | 13,101.6 |
| Revenue Growth, % | 0 | 49.74 | 18.56 | 15.08 | 19.82 | 25.8 | 25.8 | 25.8 | 25.8 | 25.8 |
| EBITDA | 132.7 | 198.0 | 188.5 | 180.7 | 201.3 | 333.7 | 419.8 | 528.1 | 664.4 | 835.8 |
| EBITDA, % | 7.81 | 7.78 | 6.25 | 5.21 | 4.84 | 6.38 | 6.38 | 6.38 | 6.38 | 6.38 |
| Depreciation | 18.5 | 23.5 | 35.1 | 50.1 | 49.9 | 60.9 | 76.6 | 96.4 | 121.3 | 152.6 |
| Depreciation, % | 1.09 | 0.92485 | 1.16 | 1.44 | 1.2 | 1.16 | 1.16 | 1.16 | 1.16 | 1.16 |
| EBIT | 114.1 | 174.5 | 153.4 | 130.6 | 151.4 | 272.8 | 343.1 | 431.7 | 543.1 | 683.2 |
| EBIT, % | 6.72 | 6.86 | 5.09 | 3.76 | 3.64 | 5.21 | 5.21 | 5.21 | 5.21 | 5.21 |
| Total Cash | 397.5 | 715.9 | 477.7 | 568.7 | 1,126.5 | 1,159.9 | 1,459.2 | 1,835.8 | 2,309.4 | 2,905.3 |
| Total Cash, percent | .0 | .0 | .0 | .0 | .0 | .0 | .0 | .0 | .0 | .0 |
| Account Receivables | 720.0 | 1,208.6 | 1,687.9 | 1,612.2 | 2,025.7 | 2,522.0 | 3,172.8 | 3,991.5 | 5,021.4 | 6,317.0 |
| Account Receivables, % | 42.39 | 47.52 | 55.98 | 46.46 | 48.72 | 48.22 | 48.22 | 48.22 | 48.22 | 48.22 |
| Inventories | 231.0 | 354.7 | 416.0 | 442.2 | 492.1 | 689.6 | 867.6 | 1,091.4 | 1,373.0 | 1,727.3 |
| Inventories, % | 13.6 | 13.95 | 13.79 | 12.74 | 11.83 | 13.18 | 13.18 | 13.18 | 13.18 | 13.18 |
| Accounts Payable | 148.1 | 235.1 | 562.9 | 923.6 | 1,381.0 | 1,009.1 | 1,269.5 | 1,597.1 | 2,009.2 | 2,527.6 |
| Accounts Payable, % | 8.72 | 9.24 | 18.67 | 26.62 | 33.21 | 19.29 | 19.29 | 19.29 | 19.29 | 19.29 |
| Capital Expenditure | -26.1 | -39.1 | -58.8 | -69.6 | -91.6 | -96.6 | -121.5 | -152.9 | -192.3 | -242.0 |
| Capital Expenditure, % | -1.54 | -1.54 | -1.95 | -2.01 | -2.2 | -1.85 | -1.85 | -1.85 | -1.85 | -1.85 |
| Tax Rate, % | 11.12 | 11.12 | 11.12 | 11.12 | 11.12 | 11.12 | 11.12 | 11.12 | 11.12 | 11.12 |
| EBITAT | 97.3 | 151.1 | 135.7 | 111.4 | 134.6 | 237.0 | 298.2 | 375.1 | 471.9 | 593.6 |
| Depreciation | ||||||||||
| Changes in Account Receivables | ||||||||||
| Changes in Inventories | ||||||||||
| Changes in Accounts Payable | ||||||||||
| Capital Expenditure | ||||||||||
| UFCF | -713.3 | -389.8 | -100.8 | 502.1 | 86.8 | -864.4 | -315.0 | -396.3 | -498.6 | -627.3 |
| WACC, % | 6.34 | 6.35 | 6.36 | 6.34 | 6.36 | 6.35 | 6.35 | 6.35 | 6.35 | 6.35 |
| PV UFCF | ||||||||||
| SUM PV UFCF | -2,271.6 | |||||||||
| Long Term Growth Rate, % | 2.00 | |||||||||
| Free cash flow (T + 1) | -640 | |||||||||
| Terminal Value | -14,703 | |||||||||
| Present Terminal Value | -10,807 | |||||||||
| Enterprise Value | -13,078 | |||||||||
| Net Debt | 178 | |||||||||
| Equity Value | -13,256 | |||||||||
| Diluted Shares Outstanding, MM | 534 | |||||||||
| Equity Value Per Share | -24.80 |
What You'll Receive
- Pre-Loaded Financial Model: Hunan Valin Wire & Cable's actual data facilitates accurate DCF valuation.
- Comprehensive Forecast Control: Modify revenue growth rates, profit margins, WACC, and other essential factors.
- Instantaneous Calculations: Real-time updates provide immediate results as you adjust inputs.
- Professional-Grade Template: A polished Excel file crafted for serious valuation analysis.
- Flexible and Reusable: Designed for adaptability, allowing multiple uses for in-depth forecasting.
Key Features
- 🔍 Real-Life Hunan Valin Financials: Pre-filled historical and projected data for Hunan Valin Wire & Cable Co., Ltd. (001208SZ).
- ✏️ Fully Customizable Inputs: Modify all essential parameters (yellow cells) such as WACC, growth %, and tax rates.
- 📊 Professional DCF Valuation: Integrated formulas calculate the intrinsic value of Hunan Valin using the Discounted Cash Flow method.
- ⚡ Instant Results: View Hunan Valin’s valuation immediately after applying changes.
- Scenario Analysis: Explore and compare results for different financial assumptions side-by-side.
How It Functions
- 1. Access the Template: Download and open the Excel file featuring Hunan Valin Wire & Cable Co., Ltd.'s preloaded data.
- 2. Modify Assumptions: Adjust critical inputs such as growth rates, WACC, and capital expenditures.
- 3. View Results Immediately: The DCF model automatically calculates intrinsic value and NPV based on your inputs.
- 4. Explore Scenarios: Analyze various forecasts to evaluate different valuation outcomes.
- 5. Utilize with Assurance: Present detailed valuation insights to support your decision-making process.
Why Opt for Hunan Valin Wire & Cable Co., Ltd. ([001208SZ])?
- Time Efficiency: Get instant access to comprehensive wire and cable solutions without the hassle of starting from scratch.
- Enhanced Accuracy: Our reliable data and specifications ensure minimal errors in your projects and calculations.
- Fully Adaptable: Customize products and services to align with your specific needs and forecasts.
- User-Friendly Insights: Intuitive presentations and outputs simplify the analysis of project results.
- Expert-Endorsed: Our offerings are backed by industry professionals who prioritize quality and effectiveness.
Who Should Utilize This Product?
- Individual Investors: Make well-informed choices regarding investments in Hunan Valin Wire & Cable Co., Ltd. (001208SZ).
- Financial Analysts: Enhance valuation procedures with comprehensive financial models tailored for Hunan Valin Wire & Cable Co., Ltd. (001208SZ).
- Consultants: Provide clients with expert valuation insights on Hunan Valin Wire & Cable Co., Ltd. (001208SZ) efficiently and accurately.
- Business Owners: Gain an understanding of how major companies like Hunan Valin Wire & Cable Co., Ltd. (001208SZ) are valued to inform your own business strategies.
- Finance Students: Master valuation methodologies using actual data and case studies related to Hunan Valin Wire & Cable Co., Ltd. (001208SZ).
Contents of the Template
- In-Depth DCF Model: Editable framework featuring comprehensive valuation calculations.
- Actual Data: Historical and projected financials of Hunan Valin Wire & Cable Co., Ltd. (001208SZ) preloaded for your analysis.
- Adjustable Parameters: Modify WACC, growth rates, and tax assumptions to explore various scenarios.
- Financial Statements: Complete annual and quarterly summaries for enhanced insights.
- Essential Ratios: Integrated analysis for profitability, efficiency, and leverage metrics.
- Dashboard with Visual Reports: Visualizations and tables providing clear, actionable insights.
Disclaimer
All information, articles, and product details provided on this website are for general informational and educational purposes only. We do not claim any ownership over, nor do we intend to infringe upon, any trademarks, copyrights, logos, brand names, or other intellectual property mentioned or depicted on this site. Such intellectual property remains the property of its respective owners, and any references here are made solely for identification or informational purposes, without implying any affiliation, endorsement, or partnership.
We make no representations or warranties, express or implied, regarding the accuracy, completeness, or suitability of any content or products presented. Nothing on this website should be construed as legal, tax, investment, financial, medical, or other professional advice. In addition, no part of this site—including articles or product references—constitutes a solicitation, recommendation, endorsement, advertisement, or offer to buy or sell any securities, franchises, or other financial instruments, particularly in jurisdictions where such activity would be unlawful.
All content is of a general nature and may not address the specific circumstances of any individual or entity. It is not a substitute for professional advice or services. Any actions you take based on the information provided here are strictly at your own risk. You accept full responsibility for any decisions or outcomes arising from your use of this website and agree to release us from any liability in connection with your use of, or reliance upon, the content or products found herein.