
|
Innere Mongolei Ojing Science & Technology Co., Ltd. (001269.SZ) DCF -Bewertung |
Fully Editable: Tailor To Your Needs In Excel Or Sheets
Professional Design: Trusted, Industry-Standard Templates
Investor-Approved Valuation Models
MAC/PC Compatible, Fully Unlocked
No Expertise Is Needed; Easy To Follow
Inner Mongolia OJing Science & Technology Co., Ltd. (001269.SZ) Bundle
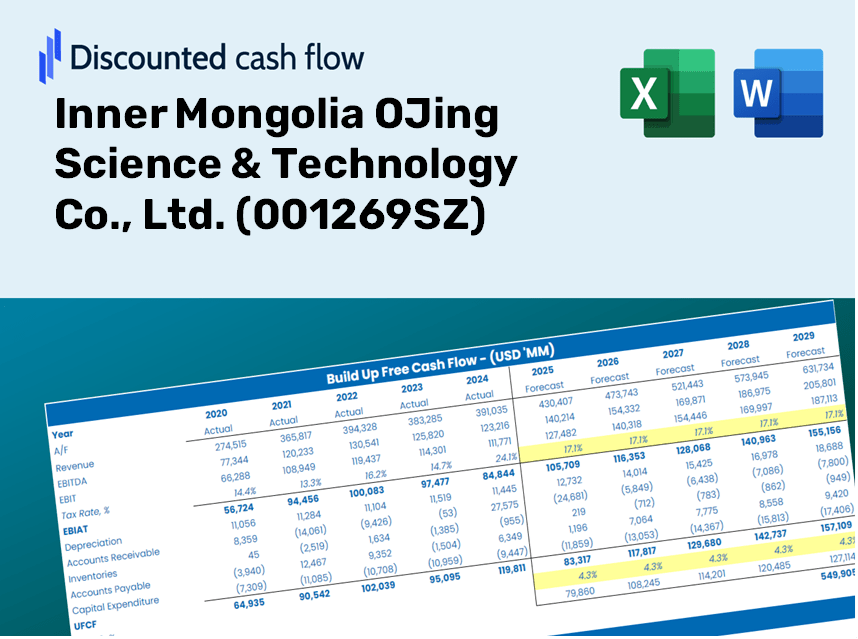
Unabhängig davon, ob Sie ein Investor oder Analyst sind, ist dies (001269SZ) DCF-Taschenrechner Ihre Anlaufstelle für eine genaue Bewertung. Vorausgeladen mit echten Daten aus der inneren Mongolien -Wissenschaft & Technology Co., Ltd., Sie können Prognosen anpassen und die Auswirkungen in Echtzeit beobachten.
Discounted Cash Flow (DCF) - (USD MM)
| Year | AY1 2020 |
AY2 2021 |
AY3 2022 |
AY4 2023 |
AY5 2024 |
FY1 2025 |
FY2 2026 |
FY3 2027 |
FY4 2028 |
FY5 2029 |
|---|---|---|---|---|---|---|---|---|---|---|
| Revenue | 559.9 | 848.4 | 1,433.8 | 3,129.3 | 946.5 | 1,303.3 | 1,794.6 | 2,471.1 | 3,402.6 | 4,685.3 |
| Revenue Growth, % | 0 | 51.53 | 69.01 | 118.25 | -69.75 | 37.7 | 37.7 | 37.7 | 37.7 | 37.7 |
| EBITDA | 129.2 | 203.3 | 330.2 | 810.2 | -515.7 | 108.1 | 148.8 | 204.9 | 282.2 | 388.6 |
| EBITDA, % | 23.07 | 23.96 | 23.03 | 25.89 | -54.48 | 8.29 | 8.29 | 8.29 | 8.29 | 8.29 |
| Depreciation | 26.6 | 42.7 | 54.3 | 71.3 | 96.1 | 67.7 | 93.3 | 128.4 | 176.8 | 243.5 |
| Depreciation, % | 4.74 | 5.03 | 3.79 | 2.28 | 10.15 | 5.2 | 5.2 | 5.2 | 5.2 | 5.2 |
| EBIT | 102.6 | 160.6 | 275.9 | 738.9 | -611.8 | 40.3 | 55.6 | 76.5 | 105.3 | 145.1 |
| EBIT, % | 18.33 | 18.93 | 19.24 | 23.61 | -64.63 | 3.1 | 3.1 | 3.1 | 3.1 | 3.1 |
| Total Cash | 6.4 | 131.2 | 442.0 | 867.3 | 419.3 | 311.3 | 428.7 | 590.3 | 812.8 | 1,119.2 |
| Total Cash, percent | .0 | .0 | .0 | .0 | .0 | .0 | .0 | .0 | .0 | .0 |
| Account Receivables | 318.6 | 520.1 | 978.4 | 1,320.5 | 443.7 | 718.2 | 988.9 | 1,361.7 | 1,875.0 | 2,581.8 |
| Account Receivables, % | 56.91 | 61.3 | 68.24 | 42.2 | 46.88 | 55.11 | 55.11 | 55.11 | 55.11 | 55.11 |
| Inventories | 30.7 | 47.2 | 105.8 | 487.8 | 116.4 | 120.7 | 166.2 | 228.8 | 315.1 | 433.9 |
| Inventories, % | 5.48 | 5.56 | 7.38 | 15.59 | 12.3 | 9.26 | 9.26 | 9.26 | 9.26 | 9.26 |
| Accounts Payable | 153.8 | 364.8 | 665.1 | 916.2 | 277.6 | 457.4 | 629.8 | 867.2 | 1,194.1 | 1,644.2 |
| Accounts Payable, % | 27.47 | 43 | 46.38 | 29.28 | 29.33 | 35.09 | 35.09 | 35.09 | 35.09 | 35.09 |
| Capital Expenditure | -24.1 | -32.8 | -144.9 | -233.5 | -120.0 | -100.2 | -137.9 | -189.9 | -261.5 | -360.1 |
| Capital Expenditure, % | -4.31 | -3.86 | -10.11 | -7.46 | -12.68 | -7.68 | -7.68 | -7.68 | -7.68 | -7.68 |
| Tax Rate, % | 16.89 | 16.89 | 16.89 | 16.89 | 16.89 | 16.89 | 16.89 | 16.89 | 16.89 | 16.89 |
| EBITAT | 89.5 | 140.4 | 242.5 | 660.3 | -508.5 | 35.1 | 48.3 | 66.6 | 91.6 | 126.2 |
| Depreciation | ||||||||||
| Changes in Account Receivables | ||||||||||
| Changes in Inventories | ||||||||||
| Changes in Accounts Payable | ||||||||||
| Capital Expenditure | ||||||||||
| UFCF | -103.6 | 143.3 | -64.8 | 25.1 | 77.2 | -96.3 | -140.1 | -192.9 | -265.7 | -365.8 |
| WACC, % | 4.6 | 4.6 | 4.6 | 4.61 | 4.58 | 4.6 | 4.6 | 4.6 | 4.6 | 4.6 |
| PV UFCF | ||||||||||
| SUM PV UFCF | -902.8 | |||||||||
| Long Term Growth Rate, % | 2.00 | |||||||||
| Free cash flow (T + 1) | -373 | |||||||||
| Terminal Value | -14,352 | |||||||||
| Present Terminal Value | -11,462 | |||||||||
| Enterprise Value | -12,365 | |||||||||
| Net Debt | 643 | |||||||||
| Equity Value | -13,008 | |||||||||
| Diluted Shares Outstanding, MM | 220 | |||||||||
| Equity Value Per Share | -59.10 |
What You Will Gain
- Authentic 001269 Financial Data: Pre-loaded with historical and forecasted data for accurate analysis.
- Completely Customizable Template: Effortlessly adjust key factors like revenue growth, WACC, and EBITDA margin.
- Instant Calculations: Watch as the intrinsic value of OJing updates instantly with your inputs.
- Professional Valuation Tool: Crafted for investors, analysts, and consultants seeking reliable DCF outcomes.
- Intuitive User Interface: Clear layout and straightforward instructions suitable for all skill levels.
Key Features
- Comprehensive DCF Calculator: Offers detailed unlevered and levered DCF valuation models tailored for Inner Mongolia OJing Science & Technology Co., Ltd. (001269SZ).
- WACC Calculator: Features a pre-built Weighted Average Cost of Capital sheet with adjustable inputs for precise calculations.
- Customizable Forecast Assumptions: Easily alter growth rates, capital expenditures, and discount rates to fit your analysis.
- Integrated Financial Ratios: Assess profitability, leverage, and efficiency ratios specifically for Inner Mongolia OJing Science & Technology Co., Ltd. (001269SZ).
- Interactive Dashboard and Charts: Visualize key valuation metrics through comprehensive charts for streamlined analysis.
How It Works
- 1. Access the Template: Download and open the Excel file containing preloaded data for Inner Mongolia OJing Science & Technology Co., Ltd. (001269SZ).
- 2. Adjust Parameters: Update essential inputs such as growth rates, WACC, and capital expenditures.
- 3. Review Instant Results: The DCF model automatically calculates the intrinsic value and NPV for your analysis.
- 4. Explore Scenarios: Evaluate various forecasts to understand different valuation results.
- 5. Present with Assurance: Share professional valuation insights to inform your decision-making process.
Why Opt for OJing's Calculator?
- Precision: Utilizes authentic Inner Mongolia OJing financial data for trustworthy results.
- Customization: Built to allow users to easily adjust and experiment with various inputs.
- Efficiency: Eliminate the need to create a DCF model from the ground up.
- Expert-Level Standards: Crafted with CFO-level accuracy and practicality in focus.
- Intuitive Design: Simple to navigate, making it accessible to those without extensive financial modeling skills.
Who Can Benefit from This Product?
- Investors: Assess the valuation of Inner Mongolia OJing Science & Technology Co., Ltd. (001269SZ) before making investment decisions.
- CFOs and Financial Analysts: Optimize valuation assessments and evaluate financial forecasts.
- Startup Founders: Understand how leading public companies like Inner Mongolia OJing Science & Technology Co., Ltd. (001269SZ) establish their market value.
- Consultants: Produce comprehensive valuation reports for your clients' needs.
- Students and Educators: Utilize real-time data to practice and demonstrate valuation methodologies.
Contents of the Template
- Preloaded OJing Data: Historical and projected financial metrics, including revenue, EBIT, and capital expenditures for Inner Mongolia OJing Science & Technology Co., Ltd. (001269SZ).
- DCF and WACC Models: Advanced spreadsheets for calculating intrinsic value and Weighted Average Cost of Capital tailored for OJing.
- Editable Inputs: Yellow-highlighted cells allowing modifications to revenue growth, tax rates, and discount rates specific to Inner Mongolia OJing Science & Technology Co., Ltd. (001269SZ).
- Financial Statements: Detailed annual and quarterly financial reports for in-depth analysis of OJing's performance.
- Key Ratios: Profitability, leverage, and efficiency ratios for assessing Inner Mongolia OJing Science & Technology Co., Ltd. (001269SZ)'s performance.
- Dashboard and Charts: Visual representations of valuation results and underlying assumptions for OJing.
Disclaimer
All information, articles, and product details provided on this website are for general informational and educational purposes only. We do not claim any ownership over, nor do we intend to infringe upon, any trademarks, copyrights, logos, brand names, or other intellectual property mentioned or depicted on this site. Such intellectual property remains the property of its respective owners, and any references here are made solely for identification or informational purposes, without implying any affiliation, endorsement, or partnership.
We make no representations or warranties, express or implied, regarding the accuracy, completeness, or suitability of any content or products presented. Nothing on this website should be construed as legal, tax, investment, financial, medical, or other professional advice. In addition, no part of this site—including articles or product references—constitutes a solicitation, recommendation, endorsement, advertisement, or offer to buy or sell any securities, franchises, or other financial instruments, particularly in jurisdictions where such activity would be unlawful.
All content is of a general nature and may not address the specific circumstances of any individual or entity. It is not a substitute for professional advice or services. Any actions you take based on the information provided here are strictly at your own risk. You accept full responsibility for any decisions or outcomes arising from your use of this website and agree to release us from any liability in connection with your use of, or reliance upon, the content or products found herein.