
|
Zhejiang Chengchang Technology Co., Ltd. (001270.sz) DCF -Bewertung |
Fully Editable: Tailor To Your Needs In Excel Or Sheets
Professional Design: Trusted, Industry-Standard Templates
Investor-Approved Valuation Models
MAC/PC Compatible, Fully Unlocked
No Expertise Is Needed; Easy To Follow
Zhejiang Chengchang Technology Co., Ltd. (001270.SZ) Bundle
Unser (001270SZ) DCF-Taschenrechner konzipiert für die Genauigkeit, ermöglicht es Ihnen, Zhejiang Chengchang Technology Co., Ltd., unter Verwendung realer Finanzdaten zu bewerten, und bietet vollständige Flexibilität, um alle wesentlichen Parameter für verbesserte Projektionen zu ändern.
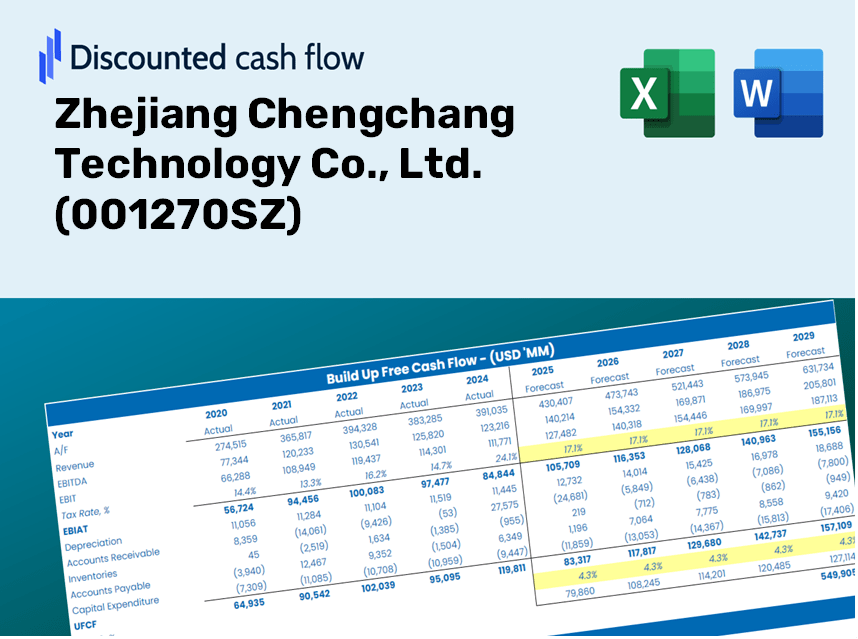
Discounted Cash Flow (DCF) - (USD MM)
| Year | AY1 2020 |
AY2 2021 |
AY3 2022 |
AY4 2023 |
AY5 2024 |
FY1 2025 |
FY2 2026 |
FY3 2027 |
FY4 2028 |
FY5 2029 |
|---|---|---|---|---|---|---|---|---|---|---|
| Revenue | 174.9 | 210.9 | 277.8 | 287.4 | 211.5 | 227.1 | 243.7 | 261.6 | 280.8 | 301.4 |
| Revenue Growth, % | 0 | 20.6 | 31.69 | 3.44 | -26.38 | 7.34 | 7.34 | 7.34 | 7.34 | 7.34 |
| EBITDA | 44.4 | 112.7 | 127.2 | 73.8 | -24.3 | 63.0 | 67.7 | 72.6 | 78.0 | 83.7 |
| EBITDA, % | 25.4 | 53.42 | 45.78 | 25.7 | -11.48 | 27.76 | 27.76 | 27.76 | 27.76 | 27.76 |
| Depreciation | 6.2 | 7.7 | 8.5 | 15.4 | 26.8 | 12.9 | 13.8 | 14.8 | 15.9 | 17.1 |
| Depreciation, % | 3.55 | 3.67 | 3.06 | 5.37 | 12.69 | 5.67 | 5.67 | 5.67 | 5.67 | 5.67 |
| EBIT | 38.2 | 104.9 | 118.7 | 58.4 | -51.1 | 50.2 | 53.8 | 57.8 | 62.0 | 66.6 |
| EBIT, % | 21.85 | 49.75 | 42.72 | 20.32 | -24.17 | 22.09 | 22.09 | 22.09 | 22.09 | 22.09 |
| Total Cash | 255.0 | 257.3 | 688.6 | 507.5 | 367.8 | 227.1 | 243.7 | 261.6 | 280.8 | 301.4 |
| Total Cash, percent | .0 | .0 | .0 | .0 | .0 | .0 | .0 | .0 | .0 | .0 |
| Account Receivables | 175.9 | 283.7 | 371.5 | 454.4 | 491.9 | 227.1 | 243.7 | 261.6 | 280.8 | 301.4 |
| Account Receivables, % | 100.54 | 134.5 | 133.74 | 158.15 | 232.55 | 100 | 100 | 100 | 100 | 100 |
| Inventories | 51.4 | 79.5 | 125.7 | 186.9 | 202.4 | 124.0 | 133.1 | 142.9 | 153.3 | 164.6 |
| Inventories, % | 29.41 | 37.68 | 45.26 | 65.04 | 95.67 | 54.61 | 54.61 | 54.61 | 54.61 | 54.61 |
| Accounts Payable | .9 | 2.4 | 13.3 | 36.8 | 20.1 | 13.1 | 14.0 | 15.1 | 16.2 | 17.3 |
| Accounts Payable, % | 0.54311 | 1.14 | 4.79 | 12.79 | 9.5 | 5.75 | 5.75 | 5.75 | 5.75 | 5.75 |
| Capital Expenditure | -12.7 | -23.6 | -75.6 | -116.6 | -145.9 | -70.5 | -75.7 | -81.2 | -87.2 | -93.6 |
| Capital Expenditure, % | -7.26 | -11.21 | -27.22 | -40.58 | -68.95 | -31.05 | -31.05 | -31.05 | -31.05 | -31.05 |
| Tax Rate, % | 17.7 | 17.7 | 17.7 | 17.7 | 17.7 | 17.7 | 17.7 | 17.7 | 17.7 | 17.7 |
| EBITAT | 35.2 | 108.6 | 110.8 | 58.3 | -42.1 | 46.9 | 50.3 | 54.0 | 58.0 | 62.3 |
| Depreciation | ||||||||||
| Changes in Account Receivables | ||||||||||
| Changes in Inventories | ||||||||||
| Changes in Accounts Payable | ||||||||||
| Capital Expenditure | ||||||||||
| UFCF | -197.7 | -41.8 | -79.5 | -163.6 | -230.7 | 325.5 | -36.3 | -39.0 | -41.8 | -44.9 |
| WACC, % | 4.52 | 4.53 | 4.52 | 4.53 | 4.52 | 4.52 | 4.52 | 4.52 | 4.52 | 4.52 |
| PV UFCF | ||||||||||
| SUM PV UFCF | 173.0 | |||||||||
| Long Term Growth Rate, % | 4.00 | |||||||||
| Free cash flow (T + 1) | -47 | |||||||||
| Terminal Value | -8,906 | |||||||||
| Present Terminal Value | -7,139 | |||||||||
| Enterprise Value | -6,966 | |||||||||
| Net Debt | -368 | |||||||||
| Equity Value | -6,598 | |||||||||
| Diluted Shares Outstanding, MM | 204 | |||||||||
| Equity Value Per Share | -32.42 |
Benefits You Will Receive
- Authentic Zhejiang Chengchang Data: Preloaded financial metrics – from revenue to EBIT – derived from actual and projected statistics.
- Comprehensive Customization: Modify all key parameters (yellow cells) such as WACC, growth %, and tax rates to fit your analysis.
- Real-Time Valuation Updates: Automatic recalibrations to assess the effects of changes on the fair value of Zhejiang Chengchang Technology Co., Ltd. (001270SZ).
- Flexible Excel Template: Designed for quick modifications, scenario analyses, and in-depth forecasting.
- Efficient and Precise: Avoid the hassle of building models from the ground up while ensuring accuracy and adaptability.
Core Capabilities
- Customizable Forecast Inputs: Adjust essential factors such as revenue growth, EBITDA margin, and capital expenditures with ease.
- Instant DCF Valuation: Automatically computes intrinsic value, NPV, and other financial metrics.
- High-Precision Results: Incorporates real-world financial data from Zhejiang Chengchang Technology Co., Ltd. (001270SZ) for reliable valuation results.
- Effortless Scenario Analysis: Evaluate various assumptions and analyze results effortlessly.
- Efficiency Booster: Streamline the valuation process without the hassle of creating complex models from the ground up.
How It Functions
- Step 1: Download the Excel template.
- Step 2: Examine the pre-filled financial data and projections for Zhejiang Chengchang Technology Co., Ltd. (001270SZ).
- Step 3: Adjust key parameters such as revenue growth, WACC, and tax rates (cells highlighted for your convenience).
- Step 4: Observe the DCF model refresh in real-time as you change your inputs.
- Step 5: Review the results and leverage the insights for your investment strategies.
Why Choose This Calculator?
- User-Friendly Interface: Perfectly crafted for both novices and seasoned professionals.
- Customizable Inputs: Effortlessly adjust parameters to suit your analysis needs.
- Real-Time Feedback: Gain immediate insights into Zhejiang Chengchang Technology Co., Ltd.'s (001270SZ) valuation as you tweak the inputs.
- Preloaded Financial Data: Comes with Zhejiang Chengchang's actual financial figures for swift evaluations.
- Preferred by Experts: A go-to tool for investors and analysts seeking to make well-informed choices.
Who Can Benefit from Our Solutions?
- Investors: Make informed decisions backed by cutting-edge technology tools.
- Financial Analysts: Streamline your workflow with our easily customizable financial models.
- Consultants: Adapt our templates swiftly for client reports or presentations.
- Finance Enthusiasts: Enhance your knowledge of technology valuation with practical insights.
- Educators and Students: Leverage our resources for hands-on learning in finance and technology courses.
Contents of the Template
- Pre-Filled Data: Features Zhejiang Chengchang Technology Co., Ltd.’s historical financial performance and projections.
- Discounted Cash Flow Model: An editable DCF valuation model with automated calculations for convenience.
- Weighted Average Cost of Capital (WACC): A specific sheet designed for WACC calculations using customizable inputs.
- Key Financial Ratios: Evaluate the profitability, efficiency, and leverage of Zhejiang Chengchang Technology Co., Ltd.
- Customizable Inputs: Easily modify revenue growth, profit margins, and tax rates.
- Clear Dashboard: Visual representations and tables displaying essential valuation outcomes.
Disclaimer
All information, articles, and product details provided on this website are for general informational and educational purposes only. We do not claim any ownership over, nor do we intend to infringe upon, any trademarks, copyrights, logos, brand names, or other intellectual property mentioned or depicted on this site. Such intellectual property remains the property of its respective owners, and any references here are made solely for identification or informational purposes, without implying any affiliation, endorsement, or partnership.
We make no representations or warranties, express or implied, regarding the accuracy, completeness, or suitability of any content or products presented. Nothing on this website should be construed as legal, tax, investment, financial, medical, or other professional advice. In addition, no part of this site—including articles or product references—constitutes a solicitation, recommendation, endorsement, advertisement, or offer to buy or sell any securities, franchises, or other financial instruments, particularly in jurisdictions where such activity would be unlawful.
All content is of a general nature and may not address the specific circumstances of any individual or entity. It is not a substitute for professional advice or services. Any actions you take based on the information provided here are strictly at your own risk. You accept full responsibility for any decisions or outcomes arising from your use of this website and agree to release us from any liability in connection with your use of, or reliance upon, the content or products found herein.