
|
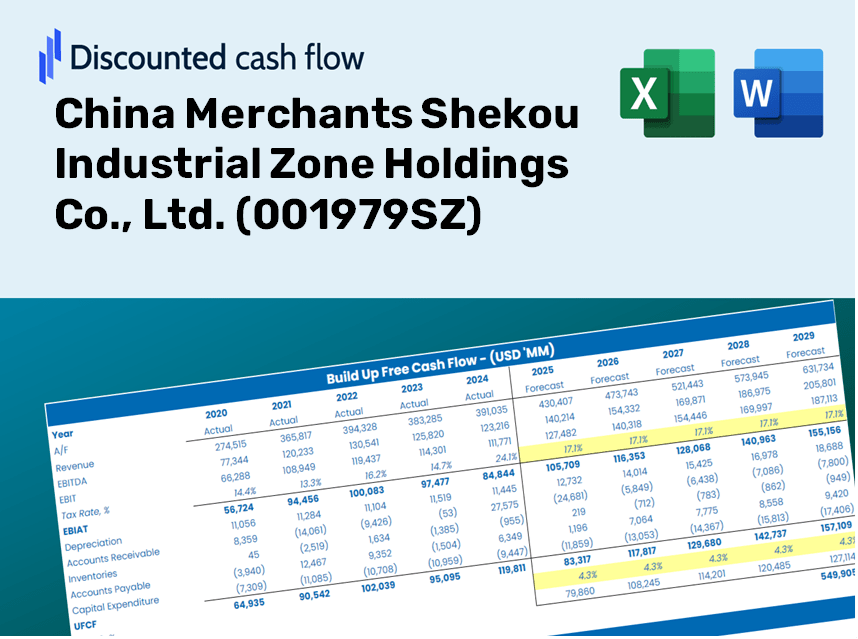
China Händler Shekou Industrial Zone Holdings Co., Ltd. (001979.SZ) DCF -Bewertung |
Fully Editable: Tailor To Your Needs In Excel Or Sheets
Professional Design: Trusted, Industry-Standard Templates
Investor-Approved Valuation Models
MAC/PC Compatible, Fully Unlocked
No Expertise Is Needed; Easy To Follow
China Merchants Shekou Industrial Zone Holdings Co., Ltd. (001979.SZ) Bundle
Vereinfachen Sie China Merchants Shekou Industrial Zone Holdings Co., Ltd. (001979SZ) Bewertung mit diesem anpassbaren DCF -Taschenrechner! Mit Real China Merchants Shekou Industrial Zone Holdings Co., Ltd. (001979SZ) Finanzdaten und einstellbare Prognoseeingänge können Sie Szenarien testen und China Händler Shekou Industrial Zone Holdings Co.
What You'll Receive
- Customizable Excel Template: A fully adjustable Excel-based DCF Calculator featuring pre-populated financial data for China Merchants Shekou Industrial Zone Holdings Co., Ltd. (001979SZ).
- Actual Data: Access to historical figures and forward-looking projections (highlighted in the yellow cells).
- Flexible Forecasting: Modify key assumptions such as revenue growth, EBITDA %, and WACC as needed.
- Instant Calculations: Quickly observe how your inputs influence the valuation of China Merchants Shekou Industrial Zone Holdings Co., Ltd. (001979SZ).
- Professional Resource: Designed for investors, CFOs, consultants, and financial analysts.
- User-Friendly Layout: Organized for clarity and simplicity, complete with step-by-step guidance.
Key Features
- 🔍 Real-Life 001979SZ Financials: Pre-filled historical and projected data for China Merchants Shekou Industrial Zone Holdings Co., Ltd.
- ✏️ Fully Customizable Inputs: Tailor all essential parameters (yellow cells) such as WACC, growth %, and tax rates.
- 📊 Professional DCF Valuation: Integrated formulas calculate the intrinsic value of the company using the Discounted Cash Flow method.
- ⚡ Instant Results: Visualize the valuation of China Merchants Shekou immediately after adjustments.
- Scenario Analysis: Evaluate and compare different outcomes based on various financial assumptions side-by-side.
How It Works
- Step 1: Download the Excel file.
- Step 2: Examine the pre-filled data for China Merchants Shekou Industrial Zone Holdings Co., Ltd. (001979SZ) (historical and projected).
- Step 3: Modify key assumptions (yellow cells) according to your analysis.
- Step 4: Observe automatic recalculations for the intrinsic value of China Merchants Shekou Industrial Zone Holdings Co., Ltd. (001979SZ).
- Step 5: Utilize the results for investment decisions or reporting.
Why Opt for This Calculator?
- Designed for Experts: A sophisticated tool utilized by analysts, CFOs, and industry consultants.
- Accurate Financial Data: Historical and projected financials of China Merchants Shekou (001979SZ) preloaded for precision.
- Flexible Scenario Analysis: Effortlessly test various forecasts and assumptions.
- Comprehensive Outputs: Instantly computes intrinsic value, NPV, and essential performance metrics.
- User-Friendly Interface: Step-by-step guidance ensures a seamless experience.
Who Can Benefit from This Product?
- Investors: Enhance your investment strategies with a top-tier valuation tool tailored for making informed decisions regarding China Merchants Shekou Industrial Zone Holdings Co., Ltd. (001979SZ).
- Financial Analysts: Streamline your analysis process with a customizable DCF model designed specifically for the real estate sector.
- Consultants: Efficiently modify the template for impactful client presentations or comprehensive reports on China Merchants Shekou Industrial Zone Holdings Co., Ltd. (001979SZ).
- Finance Enthusiasts: Expand your knowledge of advanced valuation methodologies through practical, real-world scenarios linked to China Merchants Shekou Industrial Zone Holdings Co., Ltd. (001979SZ).
- Educators and Students: Utilize this resource as a hands-on learning instrument in finance courses focused on real estate and investment evaluation.
Contents of the Template
- Comprehensive DCF Model: An editable template featuring detailed valuation calculations.
- Real-World Data: Preloaded historical and projected financials for China Merchants Shekou Industrial Zone Holdings Co., Ltd. (001979SZ) to facilitate analysis.
- Customizable Parameters: Modify WACC, growth rates, and tax assumptions to explore various scenarios.
- Financial Statements: Complete annual and quarterly breakdowns for more profound insights.
- Key Ratios: Integrated analysis for profitability, efficiency, and leverage metrics.
- Dashboard with Visual Outputs: Visualizations such as charts and tables for clear and actionable results.
Disclaimer
All information, articles, and product details provided on this website are for general informational and educational purposes only. We do not claim any ownership over, nor do we intend to infringe upon, any trademarks, copyrights, logos, brand names, or other intellectual property mentioned or depicted on this site. Such intellectual property remains the property of its respective owners, and any references here are made solely for identification or informational purposes, without implying any affiliation, endorsement, or partnership.
We make no representations or warranties, express or implied, regarding the accuracy, completeness, or suitability of any content or products presented. Nothing on this website should be construed as legal, tax, investment, financial, medical, or other professional advice. In addition, no part of this site—including articles or product references—constitutes a solicitation, recommendation, endorsement, advertisement, or offer to buy or sell any securities, franchises, or other financial instruments, particularly in jurisdictions where such activity would be unlawful.
All content is of a general nature and may not address the specific circumstances of any individual or entity. It is not a substitute for professional advice or services. Any actions you take based on the information provided here are strictly at your own risk. You accept full responsibility for any decisions or outcomes arising from your use of this website and agree to release us from any liability in connection with your use of, or reliance upon, the content or products found herein.