
|
Miracle Automation Engineering Co.LTD (002009.SZ) DCF -Bewertung |
Fully Editable: Tailor To Your Needs In Excel Or Sheets
Professional Design: Trusted, Industry-Standard Templates
Investor-Approved Valuation Models
MAC/PC Compatible, Fully Unlocked
No Expertise Is Needed; Easy To Follow
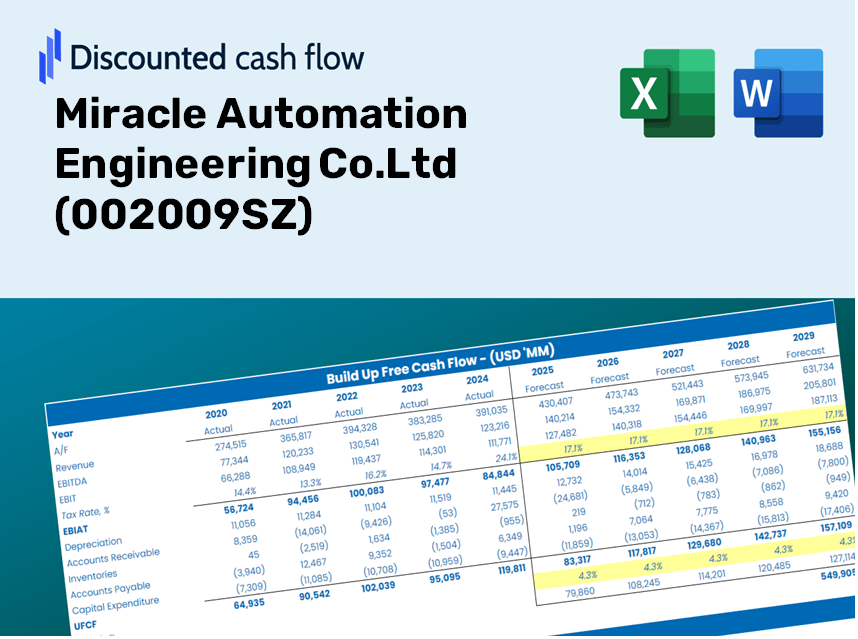
Miracle Automation Engineering Co.Ltd (002009.SZ) Bundle
Optimieren Sie Ihre Analyse und verbessern Sie die Präzision mit unserem DCF -Taschenrechner (002009sz)! Mit diesem Tool können Sie von Real Miracle Automation Engineering Co.LTD -Daten und anpassbaren Annahmen wie ein erfahrener Investor prognostizieren, analysieren und bewerten.
Discounted Cash Flow (DCF) - (USD MM)
| Year | AY1 2020 |
AY2 2021 |
AY3 2022 |
AY4 2023 |
AY5 2024 |
FY1 2025 |
FY2 2026 |
FY3 2027 |
FY4 2028 |
FY5 2029 |
|---|---|---|---|---|---|---|---|---|---|---|
| Revenue | 3,592.2 | 3,778.5 | 4,351.2 | 3,616.2 | 2,960.3 | 2,851.6 | 2,746.9 | 2,646.0 | 2,548.8 | 2,455.2 |
| Revenue Growth, % | 0 | 5.19 | 15.16 | -16.89 | -18.14 | -3.67 | -3.67 | -3.67 | -3.67 | -3.67 |
| EBITDA | 332.9 | 382.9 | 448.8 | -210.4 | -29.9 | 130.5 | 125.7 | 121.1 | 116.7 | 112.4 |
| EBITDA, % | 9.27 | 10.13 | 10.31 | -5.82 | -1.01 | 4.58 | 4.58 | 4.58 | 4.58 | 4.58 |
| Depreciation | 149.2 | 144.0 | 134.2 | 143.3 | 151.8 | 114.9 | 110.6 | 106.6 | 102.7 | 98.9 |
| Depreciation, % | 4.15 | 3.81 | 3.08 | 3.96 | 5.13 | 4.03 | 4.03 | 4.03 | 4.03 | 4.03 |
| EBIT | 183.7 | 238.9 | 314.6 | -353.7 | -181.7 | 15.7 | 15.1 | 14.5 | 14.0 | 13.5 |
| EBIT, % | 5.11 | 6.32 | 7.23 | -9.78 | -6.14 | 0.54939 | 0.54939 | 0.54939 | 0.54939 | 0.54939 |
| Total Cash | 1,022.9 | 989.2 | 1,010.0 | 978.4 | 890.2 | 769.9 | 741.6 | 714.4 | 688.2 | 662.9 |
| Total Cash, percent | .0 | .0 | .0 | .0 | .0 | .0 | .0 | .0 | .0 | .0 |
| Account Receivables | 2,071.5 | 2,057.1 | 2,206.9 | 2,191.5 | 1,916.4 | 1,643.5 | 1,583.1 | 1,525.0 | 1,469.0 | 1,415.0 |
| Account Receivables, % | 57.67 | 54.44 | 50.72 | 60.6 | 64.74 | 57.63 | 57.63 | 57.63 | 57.63 | 57.63 |
| Inventories | 877.5 | 1,082.7 | 1,359.1 | 729.9 | 570.1 | 705.8 | 679.9 | 654.9 | 630.9 | 607.7 |
| Inventories, % | 24.43 | 28.65 | 31.24 | 20.18 | 19.26 | 24.75 | 24.75 | 24.75 | 24.75 | 24.75 |
| Accounts Payable | 1,666.3 | 1,640.7 | 1,874.9 | 1,630.1 | 1,378.6 | 1,280.6 | 1,233.6 | 1,188.3 | 1,144.6 | 1,102.6 |
| Accounts Payable, % | 46.38 | 43.42 | 43.09 | 45.08 | 46.57 | 44.91 | 44.91 | 44.91 | 44.91 | 44.91 |
| Capital Expenditure | -87.0 | -196.6 | -257.9 | -271.0 | -15.6 | -123.0 | -118.5 | -114.2 | -110.0 | -105.9 |
| Capital Expenditure, % | -2.42 | -5.2 | -5.93 | -7.5 | -0.52546 | -4.31 | -4.31 | -4.31 | -4.31 | -4.31 |
| Tax Rate, % | 5.15 | 5.15 | 5.15 | 5.15 | 5.15 | 5.15 | 5.15 | 5.15 | 5.15 | 5.15 |
| EBITAT | 149.6 | 212.2 | 283.8 | -304.8 | -172.3 | 13.8 | 13.3 | 12.8 | 12.4 | 11.9 |
| Depreciation | ||||||||||
| Changes in Account Receivables | ||||||||||
| Changes in Inventories | ||||||||||
| Changes in Accounts Payable | ||||||||||
| Capital Expenditure | ||||||||||
| UFCF | -1,071.0 | -56.7 | -31.7 | -32.7 | 147.2 | 44.9 | 44.7 | 43.1 | 41.5 | 40.0 |
| WACC, % | 7.11 | 7.2 | 7.21 | 7.17 | 7.27 | 7.19 | 7.19 | 7.19 | 7.19 | 7.19 |
| PV UFCF | ||||||||||
| SUM PV UFCF | 175.4 | |||||||||
| Long Term Growth Rate, % | 3.50 | |||||||||
| Free cash flow (T + 1) | 41 | |||||||||
| Terminal Value | 1,120 | |||||||||
| Present Terminal Value | 791 | |||||||||
| Enterprise Value | 967 | |||||||||
| Net Debt | 914 | |||||||||
| Equity Value | 53 | |||||||||
| Diluted Shares Outstanding, MM | 405 | |||||||||
| Equity Value Per Share | 0.13 |
What You'll Receive
- Customizable Excel Template: A fully adaptable Excel-based DCF Calculator featuring pre-filled financials for Miracle Automation Engineering Co. Ltd (002009SZ).
- Accurate Data: Access to historical performance data and forward-looking projections (highlighted in the yellow cells).
- Flexible Forecasting: Adjust key assumptions such as revenue growth, EBITDA margin, and WACC at your discretion.
- Real-Time Calculations: Quickly observe how your inputs affect the valuation of Miracle Automation Engineering Co. Ltd (002009SZ).
- Professional-Grade Tool: Designed for investors, CFOs, consultants, and financial analysts in the field.
- User-Friendly Interface: Organized for straightforward navigation and ease of use, complete with step-by-step guidance.
Key Features
- Real-Life MAE Data: Pre-filled with Miracle Automation Engineering's historical financials and future projections.
- Fully Customizable Inputs: Adjust revenue growth rates, profit margins, discount rates, tax percentages, and capital expenditures.
- Dynamic Valuation Model: Automatic updates to Net Present Value (NPV) and intrinsic value based on your custom inputs.
- Scenario Testing: Generate multiple forecasting scenarios to evaluate various valuation outcomes.
- User-Friendly Design: Intuitive and structured, catering to both professionals and novices.
How It Functions
- Download the Template: Gain immediate access to the Excel-based MAE DCF Calculator for Miracle Automation Engineering Co. Ltd (002009SZ).
- Input Your Assumptions: Modify the yellow-highlighted cells to set growth rates, WACC, margins, and other variables.
- Instant Calculations: The model automatically recalculates the intrinsic value of Miracle Automation Engineering Co. Ltd (002009SZ).
- Test Scenarios: Experiment with various assumptions to assess potential changes in valuation.
- Analyze and Decide: Utilize the results to inform your investment or financial strategies.
Why Choose This Calculator for Miracle Automation Engineering Co. Ltd (002009SZ)?
- Reliable Data: Utilize accurate financial information from Miracle Automation for trustworthy valuation outcomes.
- Customizable Options: Tailor key inputs like growth forecasts, WACC, and tax rates to align with your financial expectations.
- Efficiency Boost: Pre-configured calculations save time and eliminate the hassle of starting from the ground up.
- Industry-Standard Tool: Crafted for investors, analysts, and consultants in the automation sector.
- Easy to Use: Clear layout and guided instructions ensure accessibility for all users, regardless of experience.
Who Can Benefit from This Product?
- Investors: Evaluate the valuation of Miracle Automation Engineering Co. Ltd (002009SZ) before making stock transactions.
- CFOs and Financial Analysts: Enhance valuation workflows and assess financial forecasts.
- Startup Founders: Gain insights into the valuation methods used for established companies like Miracle Automation Engineering Co. Ltd (002009SZ).
- Consultants: Provide detailed valuation reports to your clients using industry-leading data.
- Students and Educators: Utilize real-world examples to practice and teach valuation strategies effectively.
Contents of the Template
- Preloaded 002009SZ Data: Historical and projected financial information, including revenue, EBIT, and capital expenditures.
- DCF and WACC Models: Advanced spreadsheets designed for calculating intrinsic value and Weighted Average Cost of Capital.
- Editable Inputs: Yellow-highlighted cells for modifying revenue growth, tax rates, and discount rates.
- Financial Statements: Detailed annual and quarterly financials for in-depth analysis.
- Key Ratios: Metrics for profitability, leverage, and efficiency to assess performance.
- Dashboard and Charts: Visual representations of valuation results and underlying assumptions.
Disclaimer
All information, articles, and product details provided on this website are for general informational and educational purposes only. We do not claim any ownership over, nor do we intend to infringe upon, any trademarks, copyrights, logos, brand names, or other intellectual property mentioned or depicted on this site. Such intellectual property remains the property of its respective owners, and any references here are made solely for identification or informational purposes, without implying any affiliation, endorsement, or partnership.
We make no representations or warranties, express or implied, regarding the accuracy, completeness, or suitability of any content or products presented. Nothing on this website should be construed as legal, tax, investment, financial, medical, or other professional advice. In addition, no part of this site—including articles or product references—constitutes a solicitation, recommendation, endorsement, advertisement, or offer to buy or sell any securities, franchises, or other financial instruments, particularly in jurisdictions where such activity would be unlawful.
All content is of a general nature and may not address the specific circumstances of any individual or entity. It is not a substitute for professional advice or services. Any actions you take based on the information provided here are strictly at your own risk. You accept full responsibility for any decisions or outcomes arising from your use of this website and agree to release us from any liability in connection with your use of, or reliance upon, the content or products found herein.