
|
Zhejiang Jingxin Pharmaceutical Co., Ltd. (002020.sz) DCF -Bewertung |
Fully Editable: Tailor To Your Needs In Excel Or Sheets
Professional Design: Trusted, Industry-Standard Templates
Investor-Approved Valuation Models
MAC/PC Compatible, Fully Unlocked
No Expertise Is Needed; Easy To Follow
Zhejiang Jingxin Pharmaceutical Co., Ltd. (002020.SZ) Bundle
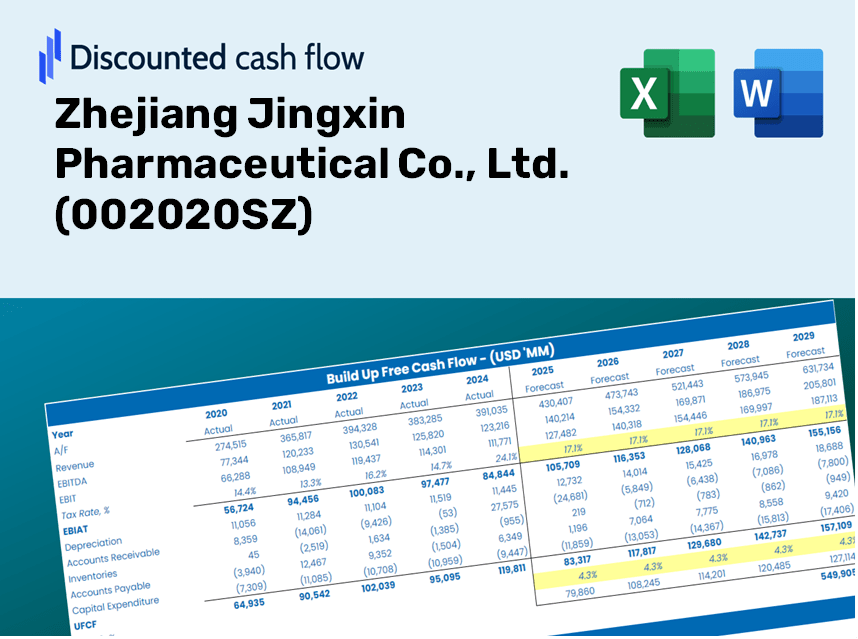
Als Anleger oder Analyst dient dieser DCF -Taschenrechner (002020SZ) als wesentliches Werkzeug für eine genaue Bewertung. Es wird mit echten Daten von Zhejiang Jingxin Pharmaceutical Co., Ltd., vorgeladen, sodass Sie die Prognosen anpassen und die Auswirkungen in Echtzeit beobachten können.
Discounted Cash Flow (DCF) - (USD MM)
| Year | AY1 2020 |
AY2 2021 |
AY3 2022 |
AY4 2023 |
AY5 2024 |
FY1 2025 |
FY2 2026 |
FY3 2027 |
FY4 2028 |
FY5 2029 |
|---|---|---|---|---|---|---|---|---|---|---|
| Revenue | 3,258.1 | 3,466.6 | 3,779.8 | 3,998.8 | 4,158.6 | 4,420.8 | 4,699.6 | 4,995.9 | 5,311.0 | 5,645.9 |
| Revenue Growth, % | 0 | 6.4 | 9.04 | 5.79 | 3.99 | 6.31 | 6.31 | 6.31 | 6.31 | 6.31 |
| EBITDA | 642.5 | 713.9 | 766.6 | 784.9 | 989.5 | 919.7 | 977.7 | 1,039.3 | 1,104.9 | 1,174.5 |
| EBITDA, % | 19.72 | 20.59 | 20.28 | 19.63 | 23.79 | 20.8 | 20.8 | 20.8 | 20.8 | 20.8 |
| Depreciation | 123.2 | 136.1 | 152.8 | 205.8 | 274.9 | 207.8 | 220.9 | 234.9 | 249.7 | 265.4 |
| Depreciation, % | 3.78 | 3.93 | 4.04 | 5.15 | 6.61 | 4.7 | 4.7 | 4.7 | 4.7 | 4.7 |
| EBIT | 519.3 | 577.8 | 613.8 | 579.1 | 714.6 | 711.8 | 756.7 | 804.4 | 855.2 | 909.1 |
| EBIT, % | 15.94 | 16.67 | 16.24 | 14.48 | 17.18 | 16.1 | 16.1 | 16.1 | 16.1 | 16.1 |
| Total Cash | 2,094.2 | 1,977.2 | 1,915.4 | 1,611.8 | 1,143.9 | 2,120.2 | 2,253.9 | 2,396.0 | 2,547.1 | 2,707.8 |
| Total Cash, percent | .0 | .0 | .0 | .0 | .0 | .0 | .0 | .0 | .0 | .0 |
| Account Receivables | 379.9 | 510.7 | 509.6 | 612.6 | 895.6 | 678.4 | 721.2 | 766.7 | 815.0 | 866.4 |
| Account Receivables, % | 11.66 | 14.73 | 13.48 | 15.32 | 21.54 | 15.35 | 15.35 | 15.35 | 15.35 | 15.35 |
| Inventories | 500.8 | 649.1 | 773.7 | 652.7 | 792.7 | 795.3 | 845.4 | 898.8 | 955.4 | 1,015.7 |
| Inventories, % | 15.37 | 18.73 | 20.47 | 16.32 | 19.06 | 17.99 | 17.99 | 17.99 | 17.99 | 17.99 |
| Accounts Payable | 369.1 | 449.8 | 719.1 | 941.2 | 880.8 | 778.4 | 827.5 | 879.7 | 935.2 | 994.2 |
| Accounts Payable, % | 11.33 | 12.98 | 19.03 | 23.54 | 21.18 | 17.61 | 17.61 | 17.61 | 17.61 | 17.61 |
| Capital Expenditure | -334.0 | -404.4 | -515.6 | -519.5 | -250.6 | -482.5 | -513.0 | -545.3 | -579.7 | -616.3 |
| Capital Expenditure, % | -10.25 | -11.67 | -13.64 | -12.99 | -6.03 | -10.92 | -10.92 | -10.92 | -10.92 | -10.92 |
| Tax Rate, % | 15.64 | 15.64 | 15.64 | 15.64 | 15.64 | 15.64 | 15.64 | 15.64 | 15.64 | 15.64 |
| EBITAT | 446.8 | 505.9 | 541.8 | 506.2 | 602.8 | 617.4 | 656.3 | 697.7 | 741.7 | 788.4 |
| Depreciation | ||||||||||
| Changes in Account Receivables | ||||||||||
| Changes in Inventories | ||||||||||
| Changes in Accounts Payable | ||||||||||
| Capital Expenditure | ||||||||||
| UFCF | -275.6 | 39.2 | 324.8 | 432.5 | 143.6 | 454.9 | 320.4 | 340.6 | 362.1 | 384.9 |
| WACC, % | 4.51 | 4.51 | 4.51 | 4.51 | 4.51 | 4.51 | 4.51 | 4.51 | 4.51 | 4.51 |
| PV UFCF | ||||||||||
| SUM PV UFCF | 1,639.4 | |||||||||
| Long Term Growth Rate, % | 3.00 | |||||||||
| Free cash flow (T + 1) | 396 | |||||||||
| Terminal Value | 26,303 | |||||||||
| Present Terminal Value | 21,100 | |||||||||
| Enterprise Value | 22,739 | |||||||||
| Net Debt | -12 | |||||||||
| Equity Value | 22,751 | |||||||||
| Diluted Shares Outstanding, MM | 858 | |||||||||
| Equity Value Per Share | 26.52 |
What You Will Receive
- Authentic Zhejiang Jingxin Data: Preloaded financial information – encompassing everything from revenue to EBIT – based on real and projected metrics.
- Comprehensive Customization: Modify all essential parameters (yellow cells) such as WACC, growth %, and tax rates.
- Immediate Valuation Adjustments: Automatic recalculations to assess the effects of adjustments on Zhejiang Jingxin’s fair value.
- Flexible Excel Template: Designed for swift edits, scenario analysis, and thorough projections.
- Efficient and Precise: Avoid the hassle of building models from the ground up while ensuring accuracy and adaptability.
Key Features
- 🔍 Real-Life JXP Financials: Pre-filled historical and projected data for Zhejiang Jingxin Pharmaceutical Co., Ltd. (002020SZ).
- ✏️ Fully Customizable Inputs: Adjust all key parameters (yellow cells) such as WACC, growth %, and tax rates.
- 📊 Professional DCF Valuation: Integrated formulas assess JXP's intrinsic value using the Discounted Cash Flow method.
- ⚡ Instant Results: Visualize JXP’s valuation in real-time after modifications.
- Scenario Analysis: Evaluate and compare outcomes for various financial assumptions side-by-side.
How It Functions
- Download: Obtain the comprehensive Excel file containing Zhejiang Jingxin Pharmaceutical Co., Ltd.'s (002020SZ) financial data.
- Customize: Tailor your forecasts, including revenue growth, EBITDA percentage, and WACC.
- Update Automatically: The intrinsic value and NPV calculations refresh in real-time.
- Test Scenarios: Generate various projections and instantly compare the results.
- Make Decisions: Use the valuation insights to inform your investment strategy.
Why Opt for Zhejiang Jingxin Pharmaceutical Co., Ltd. (002020SZ) Calculator?
- All-in-One Solution: Offers DCF, WACC, and financial ratio evaluations in a single tool.
- Adjustable Parameters: Modify the yellow-highlighted fields to explore different financial scenarios.
- In-Depth Analysis: Automatically determines the intrinsic value and Net Present Value for Zhejiang Jingxin Pharmaceutical.
- Data Ready: Comes with historical and projected data to provide reliable starting points.
- High-Caliber Output: Perfect for financial analysts, investors, and business advisors in the pharmaceutical sector.
Who Can Benefit from This Product?
- Investors: Evaluate the valuation of Zhejiang Jingxin Pharmaceutical Co., Ltd. (002020SZ) before making buy or sell decisions.
- CFOs and Financial Analysts: Optimize the valuation process and validate financial forecasts.
- Startup Founders: Understand the valuation methods applied to leading companies like Zhejiang Jingxin Pharmaceutical Co., Ltd. (002020SZ).
- Consultants: Provide clients with comprehensive valuation reports and insights.
- Students and Educators: Utilize real-life data to enhance learning and teaching of valuation strategies.
Contents of the Template
- Historical Data: Contains Zhejiang Jingxin Pharmaceutical’s financial history and initial forecasts.
- DCF and Levered DCF Models: Comprehensive templates for determining the intrinsic value of Zhejiang Jingxin Pharmaceutical (002020SZ).
- WACC Sheet: Pre-configured calculations for the Weighted Average Cost of Capital.
- Editable Inputs: Adjust critical parameters such as growth rates, EBITDA percentages, and CAPEX projections.
- Quarterly and Annual Statements: A thorough analysis of Zhejiang Jingxin Pharmaceutical’s financials.
- Interactive Dashboard: Dynamically visualize valuation outcomes and forecasts.
Disclaimer
All information, articles, and product details provided on this website are for general informational and educational purposes only. We do not claim any ownership over, nor do we intend to infringe upon, any trademarks, copyrights, logos, brand names, or other intellectual property mentioned or depicted on this site. Such intellectual property remains the property of its respective owners, and any references here are made solely for identification or informational purposes, without implying any affiliation, endorsement, or partnership.
We make no representations or warranties, express or implied, regarding the accuracy, completeness, or suitability of any content or products presented. Nothing on this website should be construed as legal, tax, investment, financial, medical, or other professional advice. In addition, no part of this site—including articles or product references—constitutes a solicitation, recommendation, endorsement, advertisement, or offer to buy or sell any securities, franchises, or other financial instruments, particularly in jurisdictions where such activity would be unlawful.
All content is of a general nature and may not address the specific circumstances of any individual or entity. It is not a substitute for professional advice or services. Any actions you take based on the information provided here are strictly at your own risk. You accept full responsibility for any decisions or outcomes arising from your use of this website and agree to release us from any liability in connection with your use of, or reliance upon, the content or products found herein.