
|
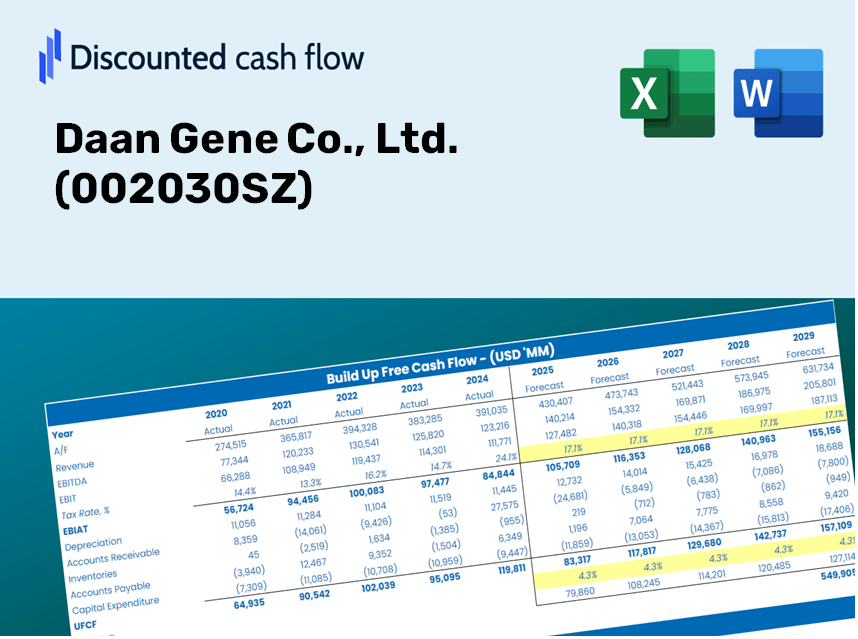
Daan Gene Co., Ltd. (002030.sz) DCF -Bewertung |
Fully Editable: Tailor To Your Needs In Excel Or Sheets
Professional Design: Trusted, Industry-Standard Templates
Investor-Approved Valuation Models
MAC/PC Compatible, Fully Unlocked
No Expertise Is Needed; Easy To Follow
Daan Gene Co., Ltd. (002030.SZ) Bundle
Optimieren Sie Ihre Analyse und verbessern Sie die Präzision mit unserem DCF -Taschenrechner [002030SZ]! Mit tatsächlichen Daten von Daan Gene Co., Ltd. und anpassbaren Annahmen ermöglichen dieses Tool Sie, [Unternehmen] wie ein erfahrener Investor zu prognostizieren, zu bewerten und zu bewerten.
Discounted Cash Flow (DCF) - (USD MM)
| Year | AY1 2020 |
AY2 2021 |
AY3 2022 |
AY4 2023 |
AY5 2024 |
FY1 2025 |
FY2 2026 |
FY3 2027 |
FY4 2028 |
FY5 2029 |
|---|---|---|---|---|---|---|---|---|---|---|
| Revenue | 5,341.2 | 7,664.3 | 12,046.1 | 1,180.9 | 853.0 | 850.3 | 847.6 | 844.9 | 842.3 | 839.6 |
| Revenue Growth, % | 0 | 43.49 | 57.17 | -90.2 | -27.76 | -0.31706 | -0.31706 | -0.31706 | -0.31706 | -0.31706 |
| EBITDA | 2,616.6 | 4,093.4 | 6,347.1 | -11.8 | -374.3 | 187.4 | 186.8 | 186.2 | 185.7 | 185.1 |
| EBITDA, % | 48.99 | 53.41 | 52.69 | -1 | -43.87 | 22.04 | 22.04 | 22.04 | 22.04 | 22.04 |
| Depreciation | 72.0 | 192.0 | 262.9 | 344.2 | 338.8 | 127.4 | 127.0 | 126.6 | 126.2 | 125.8 |
| Depreciation, % | 1.35 | 2.51 | 2.18 | 29.15 | 39.71 | 14.98 | 14.98 | 14.98 | 14.98 | 14.98 |
| EBIT | 2,544.6 | 3,901.4 | 6,084.2 | -356.0 | -713.0 | 60.1 | 59.9 | 59.7 | 59.5 | 59.3 |
| EBIT, % | 47.64 | 50.9 | 50.51 | -30.15 | -83.59 | 7.06 | 7.06 | 7.06 | 7.06 | 7.06 |
| Total Cash | 1,758.4 | 2,559.0 | 3,075.3 | 2,399.6 | 935.1 | 496.3 | 494.7 | 493.2 | 491.6 | 490.0 |
| Total Cash, percent | .0 | .0 | .0 | .0 | .0 | .0 | .0 | .0 | .0 | .0 |
| Account Receivables | 1,544.5 | 2,335.6 | 4,185.6 | 2,169.6 | 1,295.3 | 500.2 | 498.6 | 497.1 | 495.5 | 493.9 |
| Account Receivables, % | 28.92 | 30.47 | 34.75 | 183.72 | 151.84 | 58.83 | 58.83 | 58.83 | 58.83 | 58.83 |
| Inventories | 315.7 | 493.7 | 369.6 | 239.5 | 198.2 | 100.2 | 99.9 | 99.6 | 99.3 | 99.0 |
| Inventories, % | 5.91 | 6.44 | 3.07 | 20.28 | 23.24 | 11.79 | 11.79 | 11.79 | 11.79 | 11.79 |
| Accounts Payable | 474.9 | 553.0 | 737.1 | 425.4 | 357.9 | 170.4 | 169.9 | 169.3 | 168.8 | 168.3 |
| Accounts Payable, % | 8.89 | 7.22 | 6.12 | 36.03 | 41.95 | 20.04 | 20.04 | 20.04 | 20.04 | 20.04 |
| Capital Expenditure | -364.8 | -658.8 | -1,502.6 | -572.8 | -174.4 | -164.7 | -164.2 | -163.7 | -163.1 | -162.6 |
| Capital Expenditure, % | -6.83 | -8.6 | -12.47 | -48.5 | -20.45 | -19.37 | -19.37 | -19.37 | -19.37 | -19.37 |
| Tax Rate, % | 13.63 | 13.63 | 13.63 | 13.63 | 13.63 | 13.63 | 13.63 | 13.63 | 13.63 | 13.63 |
| EBITAT | 2,146.8 | 3,426.1 | 5,211.3 | -328.2 | -615.8 | 52.4 | 52.2 | 52.1 | 51.9 | 51.8 |
| Depreciation | ||||||||||
| Changes in Account Receivables | ||||||||||
| Changes in Inventories | ||||||||||
| Changes in Accounts Payable | ||||||||||
| Capital Expenditure | ||||||||||
| UFCF | 468.7 | 2,068.4 | 2,429.8 | 1,277.7 | 396.6 | 720.6 | 16.4 | 16.3 | 16.3 | 16.2 |
| WACC, % | 4.93 | 4.93 | 4.93 | 4.94 | 4.93 | 4.93 | 4.93 | 4.93 | 4.93 | 4.93 |
| PV UFCF | ||||||||||
| SUM PV UFCF | 742.0 | |||||||||
| Long Term Growth Rate, % | 3.50 | |||||||||
| Free cash flow (T + 1) | 17 | |||||||||
| Terminal Value | 1,176 | |||||||||
| Present Terminal Value | 925 | |||||||||
| Enterprise Value | 1,667 | |||||||||
| Net Debt | -715 | |||||||||
| Equity Value | 2,382 | |||||||||
| Diluted Shares Outstanding, MM | 1,402 | |||||||||
| Equity Value Per Share | 1.70 |
What You Will Receive
- Authentic Daan Gene Financials: Offers both historical and projected data for precise valuation.
- Customizable Parameters: Easily adjust WACC, tax rates, revenue growth, and capital expenditures.
- Instant Calculations: Automatically computes intrinsic value and NPV in real-time.
- Scenario Evaluation: Analyze various scenarios to assess Daan Gene's future performance.
- User-Friendly Interface: Designed for professionals, yet easy to navigate for newcomers.
Key Features
- Comprehensive Historical Data: Access Daan Gene Co., Ltd.'s (002030SZ) financial statements and insightful forecasts right at your fingertips.
- Customizable Parameters: Modify key inputs such as WACC, tax rates, revenue growth, and EBITDA margins to fit your analysis needs.
- Real-Time Valuation: Watch Daan Gene Co., Ltd.'s (002030SZ) intrinsic value update instantly as you adjust the parameters.
- Intuitive Visual Representations: Engaging dashboard charts that illustrate valuation results and critical metrics clearly.
- Engineered for Precision: A sophisticated tool designed specifically for analysts, investors, and finance professionals.
How It Works
- Download the Template: Gain instant access to the Excel-based Daan Gene Co., Ltd. DCF Calculator.
- Input Your Assumptions: Modify the yellow-highlighted cells for growth rates, WACC, margins, and more.
- Instant Calculations: The model automatically recalculates Daan Gene Co., Ltd.'s intrinsic value.
- Test Scenarios: Explore various assumptions to assess potential changes in valuation.
- Analyze and Decide: Use the findings to inform your investment or financial analysis.
Why Choose Daan Gene Co., Ltd. (002030SZ) Calculator?
- All-in-One Solution: Combines DCF, WACC, and financial ratio analyses into a single user-friendly tool.
- Flexible Inputs: Modify the highlighted cells to explore different financial scenarios.
- In-Depth Analysis: Automatically determines the intrinsic value and Net Present Value of Daan Gene Co., Ltd. (002030SZ).
- Data Rich: Comes preloaded with historical and projected data for reliable benchmarking.
- High-Quality Output: Designed for financial analysts, investors, and business consultants seeking professional-grade insights.
Who Can Benefit from This Product?
- Professional Investors: Develop comprehensive and accurate valuation models for analyzing portfolios involving Daan Gene Co., Ltd. (002030SZ).
- Corporate Finance Teams: Evaluate various valuation scenarios to inform strategic decisions within the organization.
- Consultants and Advisors: Offer clients precise valuation insights related to Daan Gene Co., Ltd. (002030SZ).
- Students and Educators: Utilize real-world data in financial modeling exercises and educational settings focusing on Daan Gene Co., Ltd. (002030SZ).
- Biotech Enthusiasts: Discover how biotech firms like Daan Gene Co., Ltd. (002030SZ) are evaluated in the marketplace.
Contents of the Template
- Historical Data: Contains Daan Gene Co., Ltd.'s past financial records and foundational forecasts.
- DCF and Levered DCF Models: Comprehensive templates designed to determine the intrinsic value of Daan Gene Co., Ltd. (002030SZ).
- WACC Sheet: Pre-calculated metrics for the Weighted Average Cost of Capital.
- Editable Inputs: Adjust critical parameters such as growth rates, EBITDA percentages, and CAPEX forecasts.
- Quarterly and Annual Statements: A thorough overview of Daan Gene Co., Ltd.’s financials.
- Interactive Dashboard: Dynamic visualization of valuation results and future projections.
Disclaimer
All information, articles, and product details provided on this website are for general informational and educational purposes only. We do not claim any ownership over, nor do we intend to infringe upon, any trademarks, copyrights, logos, brand names, or other intellectual property mentioned or depicted on this site. Such intellectual property remains the property of its respective owners, and any references here are made solely for identification or informational purposes, without implying any affiliation, endorsement, or partnership.
We make no representations or warranties, express or implied, regarding the accuracy, completeness, or suitability of any content or products presented. Nothing on this website should be construed as legal, tax, investment, financial, medical, or other professional advice. In addition, no part of this site—including articles or product references—constitutes a solicitation, recommendation, endorsement, advertisement, or offer to buy or sell any securities, franchises, or other financial instruments, particularly in jurisdictions where such activity would be unlawful.
All content is of a general nature and may not address the specific circumstances of any individual or entity. It is not a substitute for professional advice or services. Any actions you take based on the information provided here are strictly at your own risk. You accept full responsibility for any decisions or outcomes arising from your use of this website and agree to release us from any liability in connection with your use of, or reliance upon, the content or products found herein.