
|
Gotion High-Tech Co., Ltd. (002074.SZ) DCF -Bewertung |
Fully Editable: Tailor To Your Needs In Excel Or Sheets
Professional Design: Trusted, Industry-Standard Templates
Investor-Approved Valuation Models
MAC/PC Compatible, Fully Unlocked
No Expertise Is Needed; Easy To Follow
Gotion High-tech Co.,Ltd. (002074.SZ) Bundle
Entdecken Sie die finanziellen Aussichten von Gotion High-Tech Co., Ltd. mit unserem benutzerfreundlichen DCF-Taschenrechner! Geben Sie einfach Ihre Prognosen für Wachstum, Margen und Ausgaben ein, um Gotion High-Tech Co., Ltd.s innerer Wert zu berechnen und Ihren Investitionsansatz zu formen.
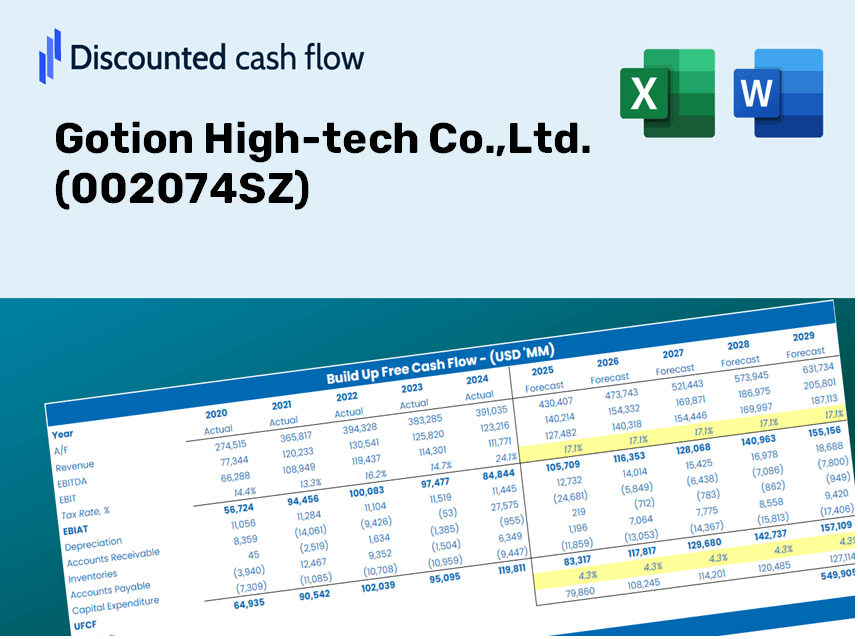
Discounted Cash Flow (DCF) - (USD MM)
| Year | AY1 2020 |
AY2 2021 |
AY3 2022 |
AY4 2023 |
AY5 2024 |
FY1 2025 |
FY2 2026 |
FY3 2027 |
FY4 2028 |
FY5 2029 |
|---|---|---|---|---|---|---|---|---|---|---|
| Revenue | 6,724.2 | 10,356.1 | 23,051.7 | 31,605.5 | 35,391.8 | 53,361.9 | 80,456.1 | 121,307.4 | 182,900.6 | 275,767.7 |
| Revenue Growth, % | 0 | 54.01 | 122.59 | 37.11 | 11.98 | 50.77 | 50.77 | 50.77 | 50.77 | 50.77 |
| EBITDA | 632.6 | 590.4 | 710.5 | 2,288.6 | 3,548.1 | 3,784.0 | 5,705.3 | 8,602.2 | 12,969.9 | 19,555.3 |
| EBITDA, % | 9.41 | 5.7 | 3.08 | 7.24 | 10.03 | 7.09 | 7.09 | 7.09 | 7.09 | 7.09 |
| Depreciation | 600.3 | 804.9 | 1,068.7 | 1,830.4 | 2,334.0 | 3,599.0 | 5,426.4 | 8,181.6 | 12,335.8 | 18,599.3 |
| Depreciation, % | 8.93 | 7.77 | 4.64 | 5.79 | 6.59 | 6.74 | 6.74 | 6.74 | 6.74 | 6.74 |
| EBIT | 32.2 | -214.6 | -358.2 | 458.2 | 1,214.1 | 185.0 | 278.9 | 420.5 | 634.1 | 956.0 |
| EBIT, % | 0.47941 | -2.07 | -1.55 | 1.45 | 3.43 | 0.34668 | 0.34668 | 0.34668 | 0.34668 | 0.34668 |
| Total Cash | 3,754.6 | 11,438.4 | 17,636.4 | 19,220.1 | 19,380.3 | 37,131.0 | 55,984.2 | 84,409.9 | 127,268.6 | 191,888.7 |
| Total Cash, percent | .0 | .0 | .0 | .0 | .0 | .0 | .0 | .0 | .0 | .0 |
| Account Receivables | 7,707.0 | 8,158.2 | 9,571.7 | 14,022.2 | 18,673.5 | 33,877.2 | 51,078.1 | 77,012.9 | 116,115.8 | 175,073.1 |
| Account Receivables, % | 114.62 | 78.78 | 41.52 | 44.37 | 52.76 | 63.49 | 63.49 | 63.49 | 63.49 | 63.49 |
| Inventories | 3,220.3 | 4,488.5 | 7,584.0 | 5,678.7 | 7,121.3 | 17,312.9 | 26,103.4 | 39,357.3 | 59,340.9 | 89,470.9 |
| Inventories, % | 47.89 | 43.34 | 32.9 | 17.97 | 20.12 | 32.44 | 32.44 | 32.44 | 32.44 | 32.44 |
| Accounts Payable | 7,048.7 | 10,235.0 | 17,330.5 | 19,535.0 | 26,007.6 | 43,682.6 | 65,862.3 | 99,303.6 | 149,724.5 | 225,746.5 |
| Accounts Payable, % | 104.83 | 98.83 | 75.18 | 61.81 | 73.48 | 81.86 | 81.86 | 81.86 | 81.86 | 81.86 |
| Capital Expenditure | -2,094.1 | -4,449.7 | -13,409.3 | -13,129.7 | -9,068.4 | -21,285.5 | -32,093.2 | -48,388.3 | -72,957.3 | -110,001.1 |
| Capital Expenditure, % | -31.14 | -42.97 | -58.17 | -41.54 | -25.62 | -39.89 | -39.89 | -39.89 | -39.89 | -39.89 |
| Tax Rate, % | 4.46 | 4.46 | 4.46 | 4.46 | 4.46 | 4.46 | 4.46 | 4.46 | 4.46 | 4.46 |
| EBITAT | 29.0 | -457.7 | -431.0 | 453.6 | 1,159.9 | 179.2 | 270.3 | 407.5 | 614.4 | 926.3 |
| Depreciation | ||||||||||
| Changes in Account Receivables | ||||||||||
| Changes in Inventories | ||||||||||
| Changes in Accounts Payable | ||||||||||
| Capital Expenditure | ||||||||||
| UFCF | -5,343.4 | -2,635.5 | -10,185.1 | -11,186.3 | -5,195.8 | -25,227.5 | -30,208.4 | -45,546.5 | -68,672.6 | -103,540.8 |
| WACC, % | 6.85 | 6.99 | 6.99 | 6.98 | 6.93 | 6.95 | 6.95 | 6.95 | 6.95 | 6.95 |
| PV UFCF | ||||||||||
| SUM PV UFCF | -213,733.2 | |||||||||
| Long Term Growth Rate, % | 2.00 | |||||||||
| Free cash flow (T + 1) | -105,612 | |||||||||
| Terminal Value | -2,134,745 | |||||||||
| Present Terminal Value | -1,525,799 | |||||||||
| Enterprise Value | -1,739,533 | |||||||||
| Net Debt | 19,820 | |||||||||
| Equity Value | -1,759,353 | |||||||||
| Diluted Shares Outstanding, MM | 1,775 | |||||||||
| Equity Value Per Share | -991.36 |
What You Will Receive
- Modifiable Forecast Inputs: Easily adjust key assumptions (growth %, margins, WACC) to explore various scenarios.
- Industry-Specific Data: Gotion High-tech Co.,Ltd. (002074SZ) financial data pre-loaded to facilitate your analysis.
- Automated DCF Outputs: The model calculates Net Present Value (NPV) and intrinsic value automatically.
- Customizable and Professional Design: A sleek Excel template tailored to meet your valuation requirements.
- Designed for Analysts and Investors: Perfect for testing forecasts, validating strategies, and maximizing efficiency.
Key Features
- Comprehensive DCF Calculator: Features detailed unlevered and levered DCF valuation models tailored for Gotion High-tech Co., Ltd. (002074SZ).
- WACC Calculator: Comes with a pre-configured Weighted Average Cost of Capital sheet that allows for customizable inputs.
- Adjustable Forecast Assumptions: Easily alter growth rates, capital expenditures, and discount rates as needed.
- Integrated Financial Ratios: Evaluate profitability, leverage, and efficiency ratios specific to Gotion High-tech Co., Ltd. (002074SZ).
- Visualization Dashboard and Charts: Graphical representations summarize vital valuation metrics for straightforward analysis.
How It Functions
- 1. Access the Template: Download and open the Excel file containing Gotion High-tech Co., Ltd.’s preloaded data.
- 2. Adjust Assumptions: Modify essential parameters such as growth rates, WACC, and capital expenditures.
- 3. View Results in Real-Time: The DCF model automatically calculates the intrinsic value and NPV.
- 4. Explore Scenarios: Analyze various forecasts to evaluate different valuation results.
- 5. Present with Assurance: Share professional valuation insights to strengthen your decision-making.
Why Choose This Calculator for Gotion High-tech Co., Ltd. (002074SZ)?
- Reliable Data: Up-to-date financials from Gotion High-tech Co., Ltd. ensure accurate valuation outcomes.
- Tailorable Options: Modify essential parameters such as growth projections, WACC, and tax rates to fit your analysis.
- Efficiency Boost: Ready-to-use calculations streamline the process and save you time.
- Expert-Level Tool: Crafted for the needs of investors, analysts, and consulting professionals.
- Easy to Use: A straightforward interface and clear instructions make it accessible for all users.
Who Can Benefit from This Product?
- Finance Students: Explore valuation methodologies and apply them using authentic data from Gotion High-tech Co., Ltd. (002074SZ).
- Academics: Integrate industry-standard models into your studies or research involving Gotion High-tech Co., Ltd. (002074SZ).
- Investors: Validate your hypotheses and evaluate valuation scenarios for Gotion High-tech Co., Ltd. (002074SZ).
- Analysts: Enhance your productivity with a user-friendly, customizable DCF model tailored for Gotion High-tech Co., Ltd. (002074SZ).
- Small Business Owners: Discover how major public corporations like Gotion High-tech Co., Ltd. (002074SZ) are assessed and valued.
Contents of the Template
- Historical Data: Contains Gotion High-tech Co., Ltd.'s (002074SZ) previous financial performance and foundational forecasts.
- DCF and Levered DCF Models: Comprehensive templates designed to calculate the intrinsic value of Gotion High-tech Co., Ltd. (002074SZ).
- WACC Sheet: Pre-established calculations for the Weighted Average Cost of Capital.
- Editable Inputs: Customize essential drivers such as growth rates, EBITDA percentages, and CAPEX assumptions.
- Quarterly and Annual Statements: An exhaustive analysis of Gotion High-tech Co., Ltd.'s (002074SZ) financial data.
- Interactive Dashboard: Dynamically visualize valuation results and projections.
Disclaimer
All information, articles, and product details provided on this website are for general informational and educational purposes only. We do not claim any ownership over, nor do we intend to infringe upon, any trademarks, copyrights, logos, brand names, or other intellectual property mentioned or depicted on this site. Such intellectual property remains the property of its respective owners, and any references here are made solely for identification or informational purposes, without implying any affiliation, endorsement, or partnership.
We make no representations or warranties, express or implied, regarding the accuracy, completeness, or suitability of any content or products presented. Nothing on this website should be construed as legal, tax, investment, financial, medical, or other professional advice. In addition, no part of this site—including articles or product references—constitutes a solicitation, recommendation, endorsement, advertisement, or offer to buy or sell any securities, franchises, or other financial instruments, particularly in jurisdictions where such activity would be unlawful.
All content is of a general nature and may not address the specific circumstances of any individual or entity. It is not a substitute for professional advice or services. Any actions you take based on the information provided here are strictly at your own risk. You accept full responsibility for any decisions or outcomes arising from your use of this website and agree to release us from any liability in connection with your use of, or reliance upon, the content or products found herein.