
|
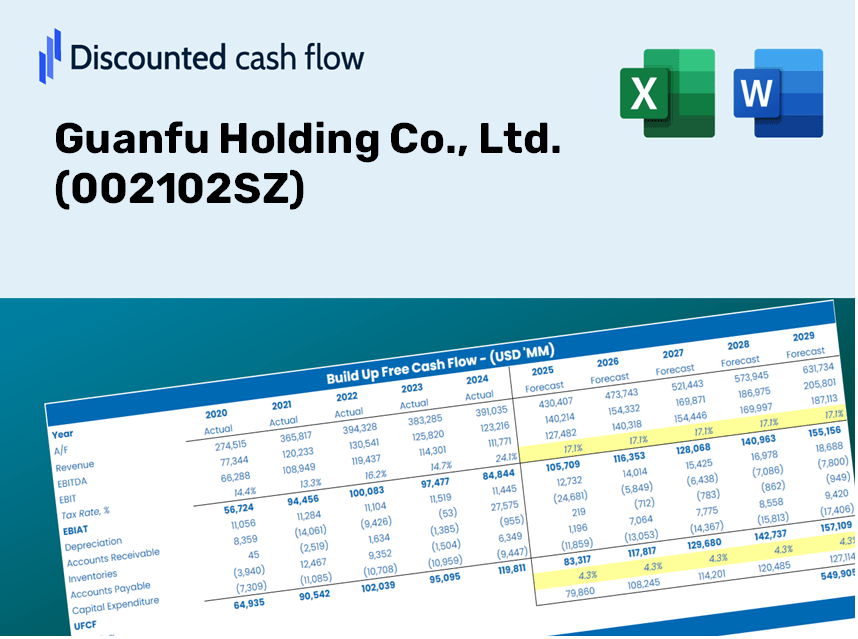
Guanfu Holding Co., Ltd. (002102.Sz) DCF -Bewertung |
Fully Editable: Tailor To Your Needs In Excel Or Sheets
Professional Design: Trusted, Industry-Standard Templates
Investor-Approved Valuation Models
MAC/PC Compatible, Fully Unlocked
No Expertise Is Needed; Easy To Follow
Guanfu Holding Co., Ltd. (002102.SZ) Bundle
Entdecken Sie die finanziellen Aussichten von Guanfu Holding Co., Ltd. (002102SZ) mit unserem benutzerfreundlichen DCF-Taschenrechner! Geben Sie Ihre Vorhersagen für Wachstum, Margen und Kosten für die Berechnung des inneren Werts von Guanfu Holding Co., Ltd. (002102SZ) ein und verbessern Sie Ihre Anlagestrategie.
Discounted Cash Flow (DCF) - (USD MM)
| Year | AY1 2020 |
AY2 2021 |
AY3 2022 |
AY4 2023 |
AY5 2024 |
FY1 2025 |
FY2 2026 |
FY3 2027 |
FY4 2028 |
FY5 2029 |
|---|---|---|---|---|---|---|---|---|---|---|
| Revenue | 12,841.7 | 13,532.6 | 12,260.3 | 11,129.1 | 12,280.4 | 12,191.3 | 12,102.9 | 12,015.0 | 11,927.8 | 11,841.3 |
| Revenue Growth, % | 0 | 5.38 | -9.4 | -9.23 | 10.35 | -0.72567 | -0.72567 | -0.72567 | -0.72567 | -0.72567 |
| EBITDA | 298.6 | 330.4 | 288.3 | 227.1 | 143.6 | 251.8 | 250.0 | 248.2 | 246.4 | 244.6 |
| EBITDA, % | 2.33 | 2.44 | 2.35 | 2.04 | 1.17 | 2.07 | 2.07 | 2.07 | 2.07 | 2.07 |
| Depreciation | 74.6 | 99.3 | 133.5 | 138.4 | 140.6 | 116.8 | 116.0 | 115.1 | 114.3 | 113.5 |
| Depreciation, % | 0.58117 | 0.73372 | 1.09 | 1.24 | 1.14 | 0.95835 | 0.95835 | 0.95835 | 0.95835 | 0.95835 |
| EBIT | 224.0 | 231.1 | 154.8 | 88.7 | 3.0 | 135.0 | 134.0 | 133.0 | 132.1 | 131.1 |
| EBIT, % | 1.74 | 1.71 | 1.26 | 0.79694 | 0.02425483 | 1.11 | 1.11 | 1.11 | 1.11 | 1.11 |
| Total Cash | 307.5 | 304.3 | 1,001.5 | 2,121.4 | 1,922.9 | 1,158.9 | 1,150.5 | 1,142.2 | 1,133.9 | 1,125.7 |
| Total Cash, percent | .0 | .0 | .0 | .0 | .0 | .0 | .0 | .0 | .0 | .0 |
| Account Receivables | 516.9 | 510.3 | 533.5 | 268.2 | 305.0 | 415.5 | 412.5 | 409.5 | 406.5 | 403.6 |
| Account Receivables, % | 4.03 | 3.77 | 4.35 | 2.41 | 2.48 | 3.41 | 3.41 | 3.41 | 3.41 | 3.41 |
| Inventories | 1,250.2 | 1,270.6 | 1,661.8 | 1,927.3 | 2,234.9 | 1,662.8 | 1,650.7 | 1,638.8 | 1,626.9 | 1,615.1 |
| Inventories, % | 9.74 | 9.39 | 13.55 | 17.32 | 18.2 | 13.64 | 13.64 | 13.64 | 13.64 | 13.64 |
| Accounts Payable | 2,658.4 | 1,732.9 | 2,357.6 | 2,738.9 | 2,412.5 | 2,364.9 | 2,347.7 | 2,330.7 | 2,313.8 | 2,297.0 |
| Accounts Payable, % | 20.7 | 12.81 | 19.23 | 24.61 | 19.64 | 19.4 | 19.4 | 19.4 | 19.4 | 19.4 |
| Capital Expenditure | -288.0 | -211.9 | -156.0 | -30.1 | -94.5 | -149.2 | -148.2 | -147.1 | -146.0 | -145.0 |
| Capital Expenditure, % | -2.24 | -1.57 | -1.27 | -0.27057 | -0.76983 | -1.22 | -1.22 | -1.22 | -1.22 | -1.22 |
| Tax Rate, % | 7.37 | 7.37 | 7.37 | 7.37 | 7.37 | 7.37 | 7.37 | 7.37 | 7.37 | 7.37 |
| EBITAT | 212.1 | 124.5 | 135.8 | 76.5 | 2.8 | 112.1 | 111.3 | 110.5 | 109.7 | 108.9 |
| Depreciation | ||||||||||
| Changes in Account Receivables | ||||||||||
| Changes in Inventories | ||||||||||
| Changes in Accounts Payable | ||||||||||
| Capital Expenditure | ||||||||||
| UFCF | 890.1 | -927.5 | 323.7 | 565.9 | -622.1 | 493.8 | 77.0 | 76.5 | 75.9 | 75.4 |
| WACC, % | 4.97 | 4.79 | 4.94 | 4.94 | 4.96 | 4.92 | 4.92 | 4.92 | 4.92 | 4.92 |
| PV UFCF | ||||||||||
| SUM PV UFCF | 728.7 | |||||||||
| Long Term Growth Rate, % | 2.00 | |||||||||
| Free cash flow (T + 1) | 77 | |||||||||
| Terminal Value | 2,632 | |||||||||
| Present Terminal Value | 2,070 | |||||||||
| Enterprise Value | 2,799 | |||||||||
| Net Debt | -901 | |||||||||
| Equity Value | 3,700 | |||||||||
| Diluted Shares Outstanding, MM | 2,633 | |||||||||
| Equity Value Per Share | 1.40 |
What You Will Receive
- Authentic Guanfu Data: Preloaded financials – encompassing revenue and EBIT – grounded in actual and projected figures.
- Comprehensive Customization: Modify all essential parameters (yellow cells) such as WACC, growth %, and tax rates.
- Real-Time Valuation Updates: Automatic recalculations that allow you to assess the effects of changes on Guanfu’s fair value.
- Flexible Excel Template: Designed for swift edits, scenario analysis, and in-depth projections.
- Efficient and Precise: Eliminate the need to create models from scratch while ensuring accuracy and adaptability.
Main Features of Guanfu Holding Co., Ltd. (002102SZ)
- Authentic Financial Data: Gain access to precise pre-loaded historical figures and future forecasts.
- Editable Forecast Metrics: Modify yellow-highlighted fields such as WACC, growth rates, and profit margins.
- Automated Calculations: Real-time updates for DCF, Net Present Value (NPV), and cash flow assessments.
- User-Friendly Dashboard: Clear charts and summaries to help you interpret your valuation outcomes.
- Suitable for All Skill Levels: A straightforward, intuitive layout designed for investors, CFOs, and consultants alike.
How It Works
- Step 1: Download the Excel file.
- Step 2: Review Guanfu Holding Co., Ltd.'s (002102SZ) pre-filled financial data and projections.
- Step 3: Adjust key inputs such as revenue growth, WACC, and tax rates (highlighted cells).
- Step 4: Observe the DCF model refresh in real-time as you make changes to the assumptions.
- Step 5: Evaluate the outputs and leverage the findings for your investment strategies.
Why Choose the Guanfu Holding Co., Ltd. ([002102SZ]) Calculator?
- Reliable Data: Access authentic financials from Guanfu Holding Co., Ltd. for trustworthy valuation outcomes.
- Flexible Options: Tailor essential variables such as growth rates, WACC, and tax rates to align with your forecasts.
- Efficient: Pre-configured calculations save you the hassle of starting from the ground up.
- Expert-Level Instrument: Crafted for investors, analysts, and financial consultants.
- Easy to Use: User-friendly design and comprehensive guidance ensure accessibility for everyone.
Who Should Utilize This Product?
- Investors: Accurately assess the fair value of Guanfu Holding Co., Ltd. (002102SZ) before making investment choices.
- CFOs: Utilize a high-quality DCF model for comprehensive financial reporting and analysis.
- Consultants: Efficiently customize the template for client valuation reports.
- Entrepreneurs: Obtain valuable insights into financial modeling practices employed by leading businesses.
- Educators: Implement it as a resource to illustrate valuation techniques in the classroom.
What the Template Includes
- Pre-Filled DCF Model: Guanfu Holding Co., Ltd.'s (002102SZ) financial data preloaded for immediate application.
- WACC Calculator: Comprehensive computations for the Weighted Average Cost of Capital.
- Financial Ratios: Assess Guanfu Holding Co., Ltd.'s (002102SZ) profitability, leverage, and operational efficiency.
- Editable Inputs: Modify assumptions such as growth rates, profit margins, and capital expenditures to suit your analysis.
- Financial Statements: Access annual and quarterly reports for in-depth financial analysis.
- Interactive Dashboard: Effortlessly visualize critical valuation metrics and outcomes.
Disclaimer
All information, articles, and product details provided on this website are for general informational and educational purposes only. We do not claim any ownership over, nor do we intend to infringe upon, any trademarks, copyrights, logos, brand names, or other intellectual property mentioned or depicted on this site. Such intellectual property remains the property of its respective owners, and any references here are made solely for identification or informational purposes, without implying any affiliation, endorsement, or partnership.
We make no representations or warranties, express or implied, regarding the accuracy, completeness, or suitability of any content or products presented. Nothing on this website should be construed as legal, tax, investment, financial, medical, or other professional advice. In addition, no part of this site—including articles or product references—constitutes a solicitation, recommendation, endorsement, advertisement, or offer to buy or sell any securities, franchises, or other financial instruments, particularly in jurisdictions where such activity would be unlawful.
All content is of a general nature and may not address the specific circumstances of any individual or entity. It is not a substitute for professional advice or services. Any actions you take based on the information provided here are strictly at your own risk. You accept full responsibility for any decisions or outcomes arising from your use of this website and agree to release us from any liability in connection with your use of, or reliance upon, the content or products found herein.