
|
Guangbo Group Stock Co., Ltd. (002103.SZ) DCF -Bewertung |
Fully Editable: Tailor To Your Needs In Excel Or Sheets
Professional Design: Trusted, Industry-Standard Templates
Investor-Approved Valuation Models
MAC/PC Compatible, Fully Unlocked
No Expertise Is Needed; Easy To Follow
Guangbo Group Stock Co., Ltd. (002103.SZ) Bundle
Bewerten Sie den finanziellen Ausblick von Guangbo Group Stock Co., Ltd. wie ein Experte! Dieser DCF-Taschenrechner (002103SZ) verfügt über vorgefüllte Finanzdaten und bietet eine vollständige Flexibilität, um das Umsatzwachstum, WACC, Margen und andere wesentliche Annahmen zu ändern, um sich an Ihren Projektionen anzupassen.
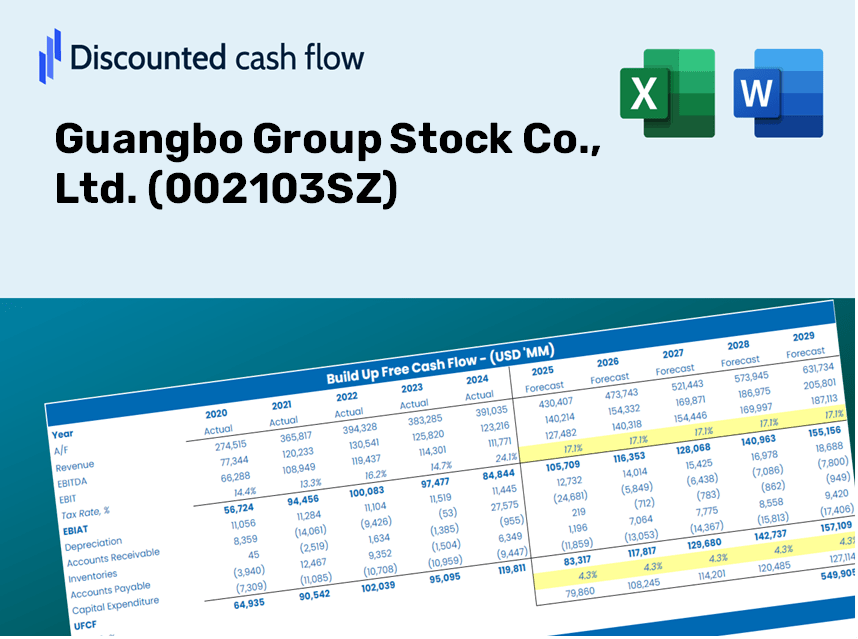
Discounted Cash Flow (DCF) - (USD MM)
| Year | AY1 2020 |
AY2 2021 |
AY3 2022 |
AY4 2023 |
AY5 2024 |
FY1 2025 |
FY2 2026 |
FY3 2027 |
FY4 2028 |
FY5 2029 |
|---|---|---|---|---|---|---|---|---|---|---|
| Revenue | 2,593.2 | 2,843.1 | 2,486.4 | 2,690.4 | 2,778.0 | 2,837.4 | 2,898.1 | 2,960.0 | 3,023.3 | 3,087.9 |
| Revenue Growth, % | 0 | 9.64 | -12.55 | 8.2 | 3.26 | 2.14 | 2.14 | 2.14 | 2.14 | 2.14 |
| EBITDA | -182.6 | 75.6 | 45.6 | 243.6 | 217.9 | 81.4 | 83.1 | 84.9 | 86.7 | 88.6 |
| EBITDA, % | -7.04 | 2.66 | 1.83 | 9.05 | 7.84 | 2.87 | 2.87 | 2.87 | 2.87 | 2.87 |
| Depreciation | 24.8 | 37.2 | 47.7 | 50.1 | 49.7 | 44.5 | 45.4 | 46.4 | 47.4 | 48.4 |
| Depreciation, % | 0.95785 | 1.31 | 1.92 | 1.86 | 1.79 | 1.57 | 1.57 | 1.57 | 1.57 | 1.57 |
| EBIT | -207.5 | 38.4 | -2.2 | 193.5 | 168.2 | 36.9 | 37.7 | 38.5 | 39.4 | 40.2 |
| EBIT, % | -8 | 1.35 | -0.08710733 | 7.19 | 6.06 | 1.3 | 1.3 | 1.3 | 1.3 | 1.3 |
| Total Cash | 354.4 | 383.5 | 579.5 | 625.8 | 658.7 | 552.9 | 564.7 | 576.8 | 589.1 | 601.7 |
| Total Cash, percent | .0 | .0 | .0 | .0 | .0 | .0 | .0 | .0 | .0 | .0 |
| Account Receivables | 584.4 | 511.6 | 700.9 | 585.6 | 665.9 | 649.5 | 663.4 | 677.6 | 692.1 | 706.9 |
| Account Receivables, % | 22.54 | 18 | 28.19 | 21.76 | 23.97 | 22.89 | 22.89 | 22.89 | 22.89 | 22.89 |
| Inventories | 167.3 | 267.2 | 215.8 | 168.4 | 178.0 | 211.1 | 215.6 | 220.2 | 224.9 | 229.7 |
| Inventories, % | 6.45 | 9.4 | 8.68 | 6.26 | 6.41 | 7.44 | 7.44 | 7.44 | 7.44 | 7.44 |
| Accounts Payable | 340.2 | 327.9 | 561.2 | 666.2 | 703.6 | 552.2 | 564.0 | 576.1 | 588.4 | 601.0 |
| Accounts Payable, % | 13.12 | 11.53 | 22.57 | 24.76 | 25.33 | 19.46 | 19.46 | 19.46 | 19.46 | 19.46 |
| Capital Expenditure | -64.0 | -47.0 | -35.9 | -13.5 | -20.5 | -38.6 | -39.4 | -40.3 | -41.1 | -42.0 |
| Capital Expenditure, % | -2.47 | -1.65 | -1.44 | -0.50114 | -0.73793 | -1.36 | -1.36 | -1.36 | -1.36 | -1.36 |
| Tax Rate, % | 5.16 | 5.16 | 5.16 | 5.16 | 5.16 | 5.16 | 5.16 | 5.16 | 5.16 | 5.16 |
| EBITAT | -209.7 | 38.2 | -3.3 | 182.7 | 159.5 | 36.1 | 36.9 | 37.7 | 38.5 | 39.3 |
| Depreciation | ||||||||||
| Changes in Account Receivables | ||||||||||
| Changes in Inventories | ||||||||||
| Changes in Accounts Payable | ||||||||||
| Capital Expenditure | ||||||||||
| UFCF | -660.3 | -11.1 | 103.9 | 487.2 | 136.1 | -126.1 | 36.3 | 37.0 | 37.8 | 38.6 |
| WACC, % | 4.47 | 4.47 | 4.47 | 4.46 | 4.46 | 4.47 | 4.47 | 4.47 | 4.47 | 4.47 |
| PV UFCF | ||||||||||
| SUM PV UFCF | 7.8 | |||||||||
| Long Term Growth Rate, % | 3.50 | |||||||||
| Free cash flow (T + 1) | 40 | |||||||||
| Terminal Value | 4,133 | |||||||||
| Present Terminal Value | 3,322 | |||||||||
| Enterprise Value | 3,330 | |||||||||
| Net Debt | 134 | |||||||||
| Equity Value | 3,196 | |||||||||
| Diluted Shares Outstanding, MM | 530 | |||||||||
| Equity Value Per Share | 6.03 |
What You Will Receive
- Genuine 002103SZ Financial Data: Provides both historical and projected figures for precise valuation.
- Customizable Parameters: Adjust WACC, tax rates, revenue growth, and capital expenditures to fit your analysis.
- Automated Calculations: Intrinsic value and NPV are computed in real-time.
- Scenario Simulation: Explore various scenarios to assess Guangbo Group's future performance.
- User-Friendly Interface: Designed for professionals while being easy to navigate for newcomers.
Key Features
- Comprehensive DCF Calculator: Features detailed unlevered and levered DCF valuation models tailored for Guangbo Group Stock Co., Ltd. (002103SZ).
- WACC Calculator: Comes with a pre-built Weighted Average Cost of Capital sheet, allowing for customizable inputs.
- Modifiable Forecast Assumptions: Easily adjust growth rates, capital expenditures, and discount rates to reflect desired scenarios.
- Integrated Financial Ratios: Evaluate profitability, leverage, and efficiency ratios specifically for Guangbo Group Stock Co., Ltd. (002103SZ).
- Visual Dashboard and Charts: Presents visual outputs that summarize essential valuation metrics for straightforward analysis.
How It Works
- Step 1: Download the pre-built Excel template featuring Guangbo Group Stock Co., Ltd.'s (002103SZ) data.
- Step 2: Review the populated sheets to familiarize yourself with the essential metrics.
- Step 3: Modify forecasts and assumptions in the editable yellow cells (WACC, growth, margins).
- Step 4: Immediately see the updated results, including the intrinsic value of Guangbo Group Stock Co., Ltd. (002103SZ).
- Step 5: Utilize the outputs to make well-informed investment choices or create reports.
Why Opt for This Calculator?
- Designed for Experts: A sophisticated tool favored by analysts, CFOs, and consultants.
- Up-to-Date Information: Guangbo Group's historical and projected financial data is preloaded for reliability.
- Scenario Analysis: Effortlessly test various forecasts and assumptions.
- Transparent Results: Automatically derives intrinsic value, NPV, and essential metrics.
- User-Friendly: Step-by-step guidance simplifies the process.
Who Should Utilize This Product?
- Investors: Accurately assess Guangbo Group Stock Co., Ltd.'s (002103SZ) intrinsic value prior to making investment choices.
- CFOs: Utilize a high-quality DCF model for financial analysis and reporting related to Guangbo Group Stock Co., Ltd. (002103SZ).
- Consultants: Efficiently modify the template for client valuation reports involving Guangbo Group Stock Co., Ltd. (002103SZ).
- Entrepreneurs: Acquire insights into the financial modeling practices of leading corporations, including Guangbo Group Stock Co., Ltd. (002103SZ).
- Educators: Implement it as an educational resource to illustrate various valuation techniques relevant to Guangbo Group Stock Co., Ltd. (002103SZ).
Contents of the Template
- Preloaded Guangbo Data: Historical and projected financial data, covering revenue, EBIT, and capital expenditures for Guangbo Group Stock Co., Ltd. (002103SZ).
- DCF and WACC Models: Advanced spreadsheets designed for calculating the intrinsic value and Weighted Average Cost of Capital.
- Editable Inputs: Yellow-highlighted cells to customize revenue growth, tax rates, and discount rates as needed.
- Financial Statements: Detailed annual and quarterly financials for in-depth analysis of the company's performance.
- Key Ratios: Analysis of profitability, leverage, and efficiency ratios to assess business performance.
- Dashboard and Charts: Visual representations of valuation results and underlying assumptions.
Disclaimer
All information, articles, and product details provided on this website are for general informational and educational purposes only. We do not claim any ownership over, nor do we intend to infringe upon, any trademarks, copyrights, logos, brand names, or other intellectual property mentioned or depicted on this site. Such intellectual property remains the property of its respective owners, and any references here are made solely for identification or informational purposes, without implying any affiliation, endorsement, or partnership.
We make no representations or warranties, express or implied, regarding the accuracy, completeness, or suitability of any content or products presented. Nothing on this website should be construed as legal, tax, investment, financial, medical, or other professional advice. In addition, no part of this site—including articles or product references—constitutes a solicitation, recommendation, endorsement, advertisement, or offer to buy or sell any securities, franchises, or other financial instruments, particularly in jurisdictions where such activity would be unlawful.
All content is of a general nature and may not address the specific circumstances of any individual or entity. It is not a substitute for professional advice or services. Any actions you take based on the information provided here are strictly at your own risk. You accept full responsibility for any decisions or outcomes arising from your use of this website and agree to release us from any liability in connection with your use of, or reliance upon, the content or products found herein.