
|
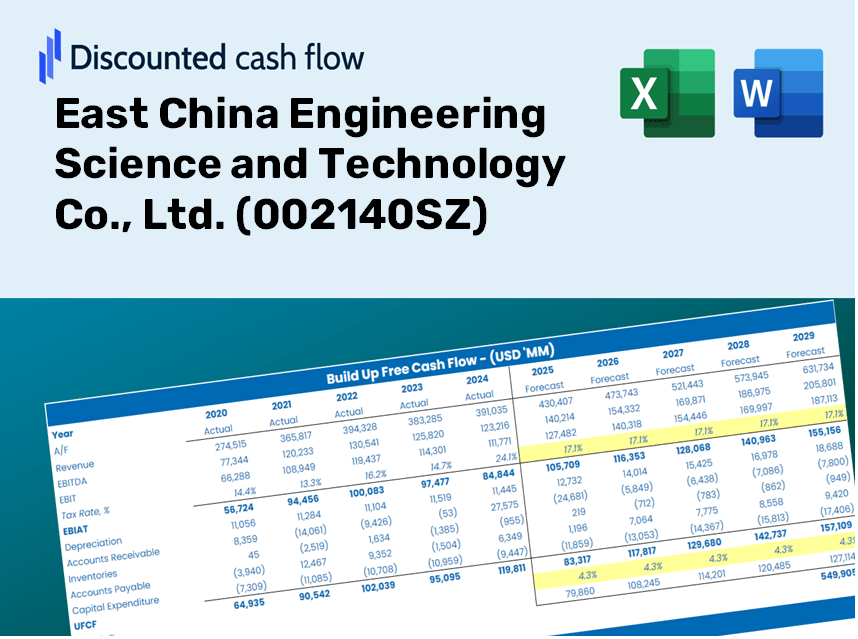
East China Engineering Science and Technology Co., Ltd. (002140.sz) DCF -Bewertung |
Fully Editable: Tailor To Your Needs In Excel Or Sheets
Professional Design: Trusted, Industry-Standard Templates
Investor-Approved Valuation Models
MAC/PC Compatible, Fully Unlocked
No Expertise Is Needed; Easy To Follow
East China Engineering Science and Technology Co., Ltd. (002140.SZ) Bundle
Gewinnen Sie Einblicke in Ihre East China Engineering Science and Technology Co., Ltd. (002140SZ) Bewertungsanalyse mit unserem hochmodernen DCF-Taschenrechner! Mit realen Daten (002140SZ) können Sie mit dieser Excel -Vorlage Prognosen und Annahmen anpassen, um den inneren Wert von East China Engineering Science and Technology Co., Ltd., genau zu bestimmen.
Benefits You Will Receive
- Comprehensive Financial Model: Utilize East China Engineering’s actual data for accurate DCF valuation.
- Complete Forecast Customization: Modify key drivers such as revenue growth, profit margins, and WACC.
- Real-Time Calculations: Automatic updates provide immediate results as you adjust inputs.
- Professional-Grade Template: A polished Excel file tailored for high-quality valuation.
- Flexible and Reusable: Designed for adaptability, suitable for in-depth forecasts over multiple uses.
Key Features
- 🔍 Real-Life ECE Financials: Pre-filled historical and projected data for East China Engineering Science and Technology Co., Ltd. (002140SZ).
- ✏️ Fully Customizable Inputs: Tailor all essential parameters (yellow cells) such as WACC, growth %, and tax rates.
- 📊 Professional DCF Valuation: Integrated formulas calculate the intrinsic value of East China Engineering using the Discounted Cash Flow method.
- ⚡ Instant Results: View the valuation of East China Engineering immediately after making adjustments.
- Scenario Analysis: Evaluate and compare various financial scenarios side-by-side.
How It Works
- Download: Obtain the comprehensive Excel file featuring East China Engineering Science and Technology Co., Ltd. (002140SZ) financial data.
- Customize: Tailor your forecasts by adjusting parameters such as revenue growth, EBITDA %, and WACC.
- Update Automatically: Watch as intrinsic value and NPV calculations refresh in real-time.
- Test Scenarios: Develop various projections and instantly compare the results.
- Make Decisions: Leverage the valuation outcomes to inform your investment approach.
Why Opt for This Calculator?
- Designed for Industry Experts: A sophisticated tool leveraged by engineers, project managers, and finance professionals.
- Comprehensive Data: East China Engineering Science and Technology Co., Ltd. (002140SZ) financials, both historical and projected, are preloaded for enhanced reliability.
- Versatile Scenario Analysis: Effortlessly explore various forecasts and scenarios.
- Insightful Outputs: Automatically computes intrinsic value, NPV, and essential performance metrics.
- User-Friendly: Clear, step-by-step guidance ensures a smooth experience.
Who Should Use This Product?
- Engineering Students: Discover project management techniques and apply them with real-world engineering data.
- Researchers: Integrate industry-standard models into your studies or publications.
- Investors: Validate your strategies and evaluate the performance metrics for East China Engineering Science and Technology Co., Ltd. (002140SZ).
- Industry Analysts: Enhance your analysis process with a customizable financial model tailored for engineering firms.
- Entrepreneurs: Understand how major engineering companies like East China Engineering Science and Technology Co., Ltd. (002140SZ) are assessed in the market.
Contents of the Template for East China Engineering Science and Technology Co., Ltd. (002140SZ)
- Comprehensive DCF Model: A customizable template featuring in-depth valuation calculations.
- Real-World Data: Historical and projected financial data for East China Engineering preloaded for thorough analysis.
- Customizable Parameters: Modify WACC, growth rates, and tax assumptions to explore various scenarios.
- Financial Statements: Complete annual and quarterly financial breakdowns for enhanced insights.
- Key Ratios: Integrated analysis tool for evaluating profitability, efficiency, and leverage metrics.
- Dashboard with Visual Outputs: Visual representations such as charts and tables for clear and actionable insights.
Disclaimer
All information, articles, and product details provided on this website are for general informational and educational purposes only. We do not claim any ownership over, nor do we intend to infringe upon, any trademarks, copyrights, logos, brand names, or other intellectual property mentioned or depicted on this site. Such intellectual property remains the property of its respective owners, and any references here are made solely for identification or informational purposes, without implying any affiliation, endorsement, or partnership.
We make no representations or warranties, express or implied, regarding the accuracy, completeness, or suitability of any content or products presented. Nothing on this website should be construed as legal, tax, investment, financial, medical, or other professional advice. In addition, no part of this site—including articles or product references—constitutes a solicitation, recommendation, endorsement, advertisement, or offer to buy or sell any securities, franchises, or other financial instruments, particularly in jurisdictions where such activity would be unlawful.
All content is of a general nature and may not address the specific circumstances of any individual or entity. It is not a substitute for professional advice or services. Any actions you take based on the information provided here are strictly at your own risk. You accept full responsibility for any decisions or outcomes arising from your use of this website and agree to release us from any liability in connection with your use of, or reliance upon, the content or products found herein.