
|
Bank of Ningbo Co., Ltd. (002142.Sz) DCF -Bewertung |
Fully Editable: Tailor To Your Needs In Excel Or Sheets
Professional Design: Trusted, Industry-Standard Templates
Investor-Approved Valuation Models
MAC/PC Compatible, Fully Unlocked
No Expertise Is Needed; Easy To Follow
Bank of Ningbo Co., Ltd. (002142.SZ) Bundle
Entdecken Sie die finanziellen Aussichten der Bank of Ningbo Co., Ltd. (002142SZ) mit unserem benutzerfreundlichen DCF-Taschenrechner! Geben Sie Ihre Prognosen für Wachstum, Margen und Kosten ein, um den inneren Wert der Bank of Ningbo Co., Ltd. (002142SZ) zu entdecken, und verfeinern Sie Ihren Anlagemansatz.
Discounted Cash Flow (DCF) - (USD MM)
| Year | AY1 2020 |
AY2 2021 |
AY3 2022 |
AY4 2023 |
AY5 2024 |
FY1 2025 |
FY2 2026 |
FY3 2027 |
FY4 2028 |
FY5 2029 |
|---|---|---|---|---|---|---|---|---|---|---|
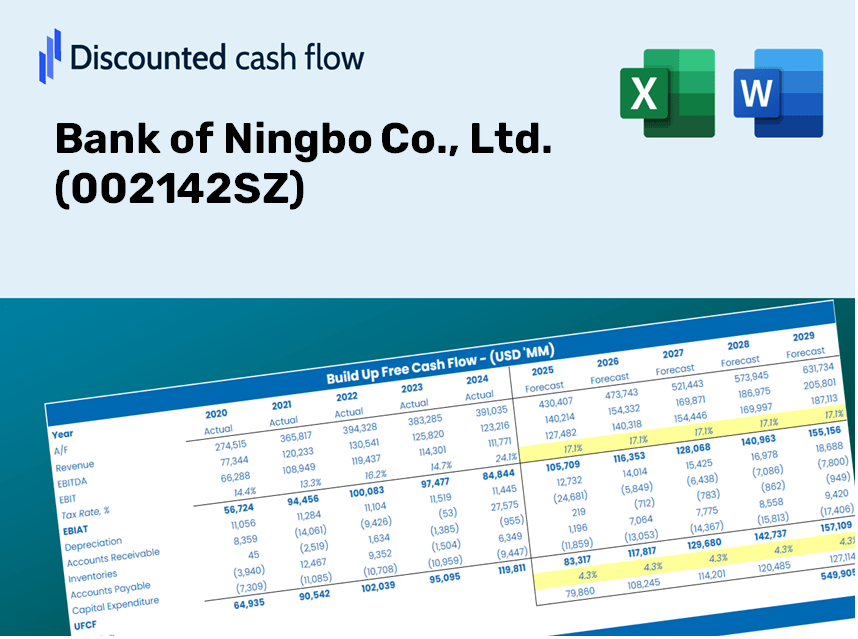
| Revenue | 41,039.0 | 52,767.0 | 57,866.0 | 52,655.0 | 66,630.0 | 75,920.9 | 86,507.4 | 98,570.1 | 112,314.8 | 127,976.1 |
| Revenue Growth, % | 0 | 28.58 | 9.66 | -9.01 | 26.54 | 13.94 | 13.94 | 13.94 | 13.94 | 13.94 |
| EBITDA | 17,233.0 | 22,100.0 | .0 | 30,307.0 | .0 | 21,475.3 | 24,469.8 | 27,881.9 | 31,769.7 | 36,199.7 |
| EBITDA, % | 41.99 | 41.88 | 0 | 57.56 | 0 | 28.29 | 28.29 | 28.29 | 28.29 | 28.29 |
| Depreciation | 960.0 | 1,906.0 | 2,089.0 | 2,409.0 | 2,461.0 | 2,707.3 | 3,084.9 | 3,515.0 | 4,005.1 | 4,563.6 |
| Depreciation, % | 2.34 | 3.61 | 3.61 | 4.58 | 3.69 | 3.57 | 3.57 | 3.57 | 3.57 | 3.57 |
| EBIT | 16,273.0 | 20,194.0 | -2,089.0 | 27,898.0 | -2,461.0 | 18,767.9 | 21,384.9 | 24,366.9 | 27,764.6 | 31,636.1 |
| EBIT, % | 39.65 | 38.27 | -3.61 | 52.98 | -3.69 | 24.72 | 24.72 | 24.72 | 24.72 | 24.72 |
| Total Cash | 149,009.0 | 162,023.0 | 172,580.0 | 43,790.0 | 222,240.0 | 73,364.5 | 83,594.5 | 95,251.0 | 108,532.9 | 123,666.8 |
| Total Cash, percent | .0 | .0 | .0 | .0 | .0 | .0 | .0 | .0 | .0 | .0 |
| Account Receivables | .0 | .0 | .0 | .0 | .0 | .0 | .0 | .0 | .0 | .0 |
| Account Receivables, % | 0 | 0 | 0 | 0 | 0 | 0 | 0 | 0 | 0 | 0 |
| Inventories | .0 | .0 | .0 | .0 | .0 | .0 | .0 | .0 | .0 | .0 |
| Inventories, % | 0 | 0 | 0 | 0 | 0 | 0 | 0 | 0 | 0 | 0 |
| Accounts Payable | .0 | .0 | .0 | .0 | .0 | .0 | .0 | .0 | .0 | .0 |
| Accounts Payable, % | 0 | 0 | 0 | 0 | 0 | 0 | 0 | 0 | 0 | 0 |
| Capital Expenditure | -1,820.0 | -2,583.0 | -2,873.0 | -3,707.0 | -3,832.0 | -4,112.8 | -4,686.3 | -5,339.8 | -6,084.4 | -6,932.8 |
| Capital Expenditure, % | -4.43 | -4.9 | -4.96 | -7.04 | -5.75 | -5.42 | -5.42 | -5.42 | -5.42 | -5.42 |
| Tax Rate, % | 13.29 | 13.29 | 13.29 | 13.29 | 13.29 | 13.29 | 13.29 | 13.29 | 13.29 | 13.29 |
| EBITAT | 14,883.5 | 19,306.0 | -1,906.8 | 25,535.0 | -2,133.8 | 17,138.0 | 19,527.8 | 22,250.8 | 25,353.4 | 28,888.7 |
| Depreciation | ||||||||||
| Changes in Account Receivables | ||||||||||
| Changes in Inventories | ||||||||||
| Changes in Accounts Payable | ||||||||||
| Capital Expenditure | ||||||||||
| UFCF | 14,023.5 | 18,629.0 | -2,690.8 | 24,237.0 | -3,504.8 | 15,732.6 | 17,926.3 | 20,426.0 | 23,274.2 | 26,519.6 |
| WACC, % | 5.45 | 5.64 | 5.44 | 5.45 | 5.23 | 5.44 | 5.44 | 5.44 | 5.44 | 5.44 |
| PV UFCF | ||||||||||
| SUM PV UFCF | 87,640.1 | |||||||||
| Long Term Growth Rate, % | 2.00 | |||||||||
| Free cash flow (T + 1) | 27,050 | |||||||||
| Terminal Value | 785,570 | |||||||||
| Present Terminal Value | 602,682 | |||||||||
| Enterprise Value | 690,323 | |||||||||
| Net Debt | -222,240 | |||||||||
| Equity Value | 912,563 | |||||||||
| Diluted Shares Outstanding, MM | 6,868 | |||||||||
| Equity Value Per Share | 132.88 |
Benefits You Will Receive
- Adjustable Financial Inputs: Effortlessly modify parameters (growth %, margins, WACC) to develop various scenarios.
- Current Financial Data: Bank of Ningbo Co., Ltd. (002142SZ) financial information pre-loaded to facilitate your analysis.
- Automatic DCF Calculations: The template computes Net Present Value (NPV) and intrinsic value automatically for you.
- Customizable and Professional Design: A sleek Excel model tailored to meet your valuation requirements.
- Designed for Analysts and Investors: Perfect for assessing forecasts, validating strategies, and enhancing efficiency.
Key Features
- 🔍 Real-Life Bank of Ningbo Financials: Pre-filled historical and projected data for Bank of Ningbo Co., Ltd. (002142SZ).
- ✏️ Fully Customizable Inputs: Modify all essential parameters (yellow cells) such as WACC, growth %, and tax rates.
- 📊 Professional DCF Valuation: Integrated formulas compute the intrinsic value of Bank of Ningbo using the Discounted Cash Flow method.
- ⚡ Instant Results: Visualize the valuation of Bank of Ningbo immediately after making any adjustments.
- Scenario Analysis: Evaluate and compare results for different financial assumptions side-by-side.
How It Works
- Download: Get the pre-formatted Excel file containing Bank of Ningbo Co., Ltd.'s (002142SZ) financial data.
- Customize: Tailor forecasts such as revenue growth, EBITDA %, and WACC to suit your analysis.
- Update Automatically: Enjoy real-time updates for intrinsic value and NPV calculations.
- Test Scenarios: Develop various projections and evaluate outcomes instantly.
- Make Decisions: Leverage the valuation results to inform your investment strategy for Bank of Ningbo Co., Ltd. (002142SZ).
Why Opt for This Calculator?
- User-Friendly Design: Suitable for both novices and seasoned users.
- Customizable Inputs: Adjust parameters effortlessly to suit your analysis.
- Real-Time Adjustments: Witness immediate updates to the valuation of Bank of Ningbo Co., Ltd. (002142SZ) as you tweak your inputs.
- Pre-Configured: Comes with Bank of Ningbo's actual financial data for swift assessments.
- Endorsed by Experts: Utilized by investors and analysts for making well-informed choices.
Who Can Benefit from This Product?
- Finance Students: Master valuation methodologies and apply them using real data from Bank of Ningbo Co., Ltd. (002142SZ).
- Academics: Enhance your coursework or research by integrating professional models related to Bank of Ningbo Co., Ltd. (002142SZ).
- Investors: Evaluate your own hypotheses and examine valuation results for Bank of Ningbo Co., Ltd. (002142SZ).
- Analysts: Optimize your analysis process with a ready-to-use, customizable DCF model tailored for Bank of Ningbo Co., Ltd. (002142SZ).
- Small Business Owners: Understand the analytical approaches used for evaluating large public corporations like Bank of Ningbo Co., Ltd. (002142SZ).
Components of the Template
- Extensive DCF Model: Editable template featuring thorough valuation computations.
- Real-World Data: Bank of Ningbo Co., Ltd.'s historical and forecasted financials preloaded for your analysis.
- Customizable Variables: Modify WACC, growth rates, and tax assumptions to explore various scenarios.
- Financial Statements: Complete annual and quarterly summaries for enhanced insights.
- Key Ratios: Integrated analysis focusing on profitability, efficiency, and leverage metrics.
- Dashboard with Visual Outputs: Engaging charts and tables providing clear, actionable insights.
Disclaimer
All information, articles, and product details provided on this website are for general informational and educational purposes only. We do not claim any ownership over, nor do we intend to infringe upon, any trademarks, copyrights, logos, brand names, or other intellectual property mentioned or depicted on this site. Such intellectual property remains the property of its respective owners, and any references here are made solely for identification or informational purposes, without implying any affiliation, endorsement, or partnership.
We make no representations or warranties, express or implied, regarding the accuracy, completeness, or suitability of any content or products presented. Nothing on this website should be construed as legal, tax, investment, financial, medical, or other professional advice. In addition, no part of this site—including articles or product references—constitutes a solicitation, recommendation, endorsement, advertisement, or offer to buy or sell any securities, franchises, or other financial instruments, particularly in jurisdictions where such activity would be unlawful.
All content is of a general nature and may not address the specific circumstances of any individual or entity. It is not a substitute for professional advice or services. Any actions you take based on the information provided here are strictly at your own risk. You accept full responsibility for any decisions or outcomes arising from your use of this website and agree to release us from any liability in connection with your use of, or reliance upon, the content or products found herein.