
|
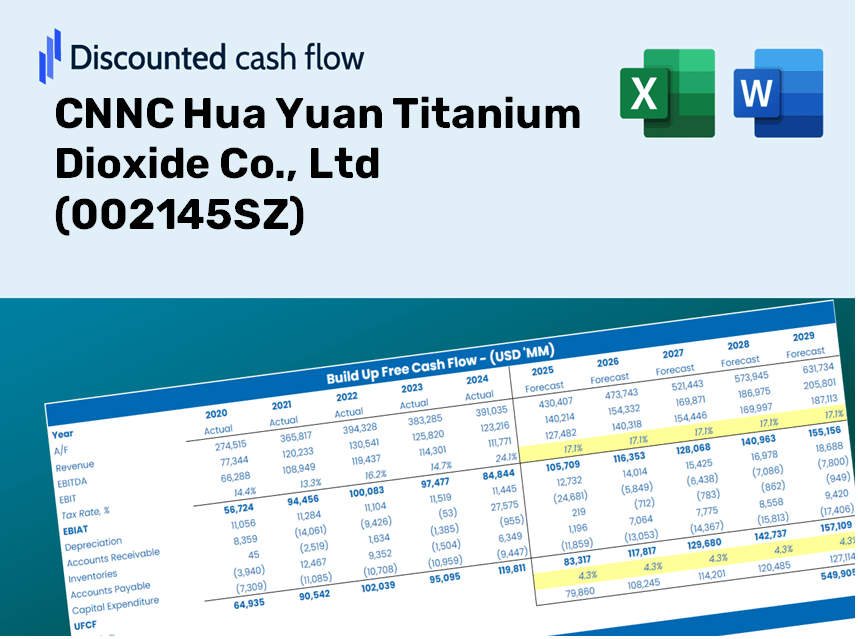
CNNC Hua Yuan Titanium Dioxid Co., Ltd (002145.SZ) DCF -Bewertung |
Fully Editable: Tailor To Your Needs In Excel Or Sheets
Professional Design: Trusted, Industry-Standard Templates
Investor-Approved Valuation Models
MAC/PC Compatible, Fully Unlocked
No Expertise Is Needed; Easy To Follow
CNNC Hua Yuan Titanium Dioxide Co., Ltd (002145.SZ) Bundle
Entdecken Sie die finanziellen Aussichten von CNNC Hua Yuan Titanium Dioxid Co., Ltd (002145SZ) mit unserem benutzerfreundlichen DCF-Taschenrechner! Geben Sie Ihre Annahmen in Bezug auf Wachstum, Margen und Ausgaben ein, um den inneren Wert von CNNC Hua Yuan Titanium Dioxid Co., Ltd (002145SZ) zu berechnen, und verfeinern Sie Ihren Investitionsansatz.
Discounted Cash Flow (DCF) - (USD MM)
| Year | AY1 2020 |
AY2 2021 |
AY3 2022 |
AY4 2023 |
AY5 2024 |
FY1 2025 |
FY2 2026 |
FY3 2027 |
FY4 2028 |
FY5 2029 |
|---|---|---|---|---|---|---|---|---|---|---|
| Revenue | 3,715.6 | 5,374.1 | 5,481.3 | 4,946.6 | 6,874.6 | 8,178.3 | 9,729.1 | 11,574.1 | 13,768.9 | 16,380.0 |
| Revenue Growth, % | 0 | 44.64 | 1.99 | -9.76 | 38.98 | 18.96 | 18.96 | 18.96 | 18.96 | 18.96 |
| EBITDA | 843.6 | 1,612.5 | 804.0 | 493.5 | 754.2 | 1,444.7 | 1,718.6 | 2,044.6 | 2,432.3 | 2,893.5 |
| EBITDA, % | 22.7 | 30 | 14.67 | 9.98 | 10.97 | 17.66 | 17.66 | 17.66 | 17.66 | 17.66 |
| Depreciation | 214.5 | 208.4 | 214.6 | 229.8 | 334.8 | 377.6 | 449.1 | 534.3 | 635.6 | 756.2 |
| Depreciation, % | 5.77 | 3.88 | 3.91 | 4.65 | 4.87 | 4.62 | 4.62 | 4.62 | 4.62 | 4.62 |
| EBIT | 629.1 | 1,404.1 | 589.5 | 263.7 | 419.4 | 1,067.1 | 1,269.5 | 1,510.2 | 1,796.6 | 2,137.3 |
| EBIT, % | 16.93 | 26.13 | 10.75 | 5.33 | 6.1 | 13.05 | 13.05 | 13.05 | 13.05 | 13.05 |
| Total Cash | 2,883.8 | 4,609.8 | 3,840.3 | 7,565.0 | 7,544.4 | 7,089.8 | 8,434.3 | 10,033.7 | 11,936.4 | 14,199.9 |
| Total Cash, percent | .0 | .0 | .0 | .0 | .0 | .0 | .0 | .0 | .0 | .0 |
| Account Receivables | 1,037.7 | 1,414.5 | 1,085.3 | 971.0 | 1,253.6 | 1,830.5 | 2,177.6 | 2,590.6 | 3,081.8 | 3,666.3 |
| Account Receivables, % | 27.93 | 26.32 | 19.8 | 19.63 | 18.24 | 22.38 | 22.38 | 22.38 | 22.38 | 22.38 |
| Inventories | 420.6 | 719.7 | 776.9 | 1,005.8 | 1,237.7 | 1,263.1 | 1,502.6 | 1,787.6 | 2,126.6 | 2,529.8 |
| Inventories, % | 11.32 | 13.39 | 14.17 | 20.33 | 18 | 15.44 | 15.44 | 15.44 | 15.44 | 15.44 |
| Accounts Payable | 1,368.6 | 2,506.3 | 2,823.1 | 2,382.2 | 2,647.5 | 3,625.3 | 4,312.8 | 5,130.7 | 6,103.6 | 7,261.1 |
| Accounts Payable, % | 36.83 | 46.64 | 51.51 | 48.16 | 38.51 | 44.33 | 44.33 | 44.33 | 44.33 | 44.33 |
| Capital Expenditure | -31.1 | -552.0 | -1,450.5 | -1,305.0 | -641.8 | -1,198.7 | -1,426.0 | -1,696.5 | -2,018.2 | -2,400.9 |
| Capital Expenditure, % | -0.83615 | -10.27 | -26.46 | -26.38 | -9.34 | -14.66 | -14.66 | -14.66 | -14.66 | -14.66 |
| Tax Rate, % | 15.72 | 15.72 | 15.72 | 15.72 | 15.72 | 15.72 | 15.72 | 15.72 | 15.72 | 15.72 |
| EBITAT | 530.2 | 1,182.6 | 505.8 | 224.5 | 353.4 | 904.4 | 1,075.9 | 1,279.9 | 1,522.6 | 1,811.3 |
| Depreciation | ||||||||||
| Changes in Account Receivables | ||||||||||
| Changes in Inventories | ||||||||||
| Changes in Accounts Payable | ||||||||||
| Capital Expenditure | ||||||||||
| UFCF | 623.9 | 1,300.8 | -141.1 | -1,406.2 | -202.7 | 458.7 | 199.8 | 237.7 | 282.8 | 336.4 |
| WACC, % | 7.13 | 7.13 | 7.14 | 7.14 | 7.13 | 7.13 | 7.13 | 7.13 | 7.13 | 7.13 |
| PV UFCF | ||||||||||
| SUM PV UFCF | 1,248.6 | |||||||||
| Long Term Growth Rate, % | 3.00 | |||||||||
| Free cash flow (T + 1) | 346 | |||||||||
| Terminal Value | 8,383 | |||||||||
| Present Terminal Value | 5,940 | |||||||||
| Enterprise Value | 7,188 | |||||||||
| Net Debt | -3,507 | |||||||||
| Equity Value | 10,696 | |||||||||
| Diluted Shares Outstanding, MM | 3,669 | |||||||||
| Equity Value Per Share | 2.91 |
What You Will Receive
- Authentic CNNC Data: Preloaded financials – encompassing revenue to EBIT – derived from actual and forecasted figures.
- Comprehensive Customization: Modify all key parameters (yellow cells) such as WACC, growth %, and tax rates to fit your analysis.
- Real-Time Valuation Updates: Automatic recalculations to assess the effects of changes on the fair value of CNNC Hua Yuan Titanium Dioxide Co., Ltd (002145SZ).
- Flexible Excel Template: Designed for quick modifications, scenario analyses, and in-depth projections.
- Efficient and Precise: Avoid creating models from scratch while ensuring accuracy and adaptability.
Key Features
- Authentic CNNC Financials: Gain access to reliable pre-loaded historical data and projections for the future.
- Adjustable Forecast Parameters: Modify highlighted cells (in yellow) such as WACC, growth rates, and profit margins.
- Real-Time Analytics: Enjoy automatic updates to DCF, Net Present Value (NPV), and cash flow assessments.
- Interactive Dashboard: Utilize user-friendly charts and summaries to represent your valuation outcomes visually.
- Designed for All Skill Levels: A straightforward, intuitive layout suitable for investors, CFOs, and consultants alike.
How It Functions
- Step 1: Download the Excel file.
- Step 2: Examine CNNC Hua Yuan Titanium Dioxide Co., Ltd's (002145SZ) pre-populated financial data and projections.
- Step 3: Adjust key variables such as revenue growth, WACC, and tax rates (highlighted cells).
- Step 4: See the DCF model refresh in real-time as you modify your assumptions.
- Step 5: Evaluate the outputs and utilize the findings for your investment strategies.
Why Opt for CNNC Hua Yuan Titanium Dioxide Co., Ltd (002145SZ)?
- Time-Saving: Skip the hassle of building a model from scratch – our tools are ready to go.
- Enhanced Accuracy: Trustworthy financial data and calculations minimize valuation errors.
- Completely Customizable: Adjust the model to fit your specific assumptions and forecasts.
- User-Friendly: Intuitive charts and results make analysis straightforward.
- Expert-Approved: Crafted for professionals who prioritize accuracy and ease of use.
Who Should Utilize This Product?
- Finance Students: Master valuation techniques and apply them to real-world data.
- Researchers: Integrate advanced financial models into academic projects or studies.
- Investors: Validate your investment hypotheses and assess valuation scenarios for CNNC Hua Yuan Titanium Dioxide Co., Ltd (002145SZ).
- Financial Analysts: Enhance your analysis process with a customizable DCF model designed for efficiency.
- Entrepreneurs: Discover the analytical methods used to evaluate large public companies like CNNC Hua Yuan Titanium Dioxide Co., Ltd (002145SZ).
What the Template Contains
- Pre-Filled DCF Model: CNNC Hua Yuan Titanium Dioxide Co., Ltd’s (002145SZ) financial data preloaded for immediate analysis.
- WACC Calculator: Detailed calculations for the Weighted Average Cost of Capital tailored for CNNC Hua Yuan Titanium Dioxide Co., Ltd (002145SZ).
- Financial Ratios: Assess profitability, leverage, and efficiency metrics for CNNC Hua Yuan Titanium Dioxide Co., Ltd (002145SZ).
- Editable Inputs: Modify assumptions such as growth rates, profit margins, and capital expenditures to align with your scenarios.
- Financial Statements: Access annual and quarterly reports to facilitate comprehensive analysis of CNNC Hua Yuan Titanium Dioxide Co., Ltd (002145SZ).
- Interactive Dashboard: Visually capture and analyze key valuation metrics and outcomes effectively.
Disclaimer
All information, articles, and product details provided on this website are for general informational and educational purposes only. We do not claim any ownership over, nor do we intend to infringe upon, any trademarks, copyrights, logos, brand names, or other intellectual property mentioned or depicted on this site. Such intellectual property remains the property of its respective owners, and any references here are made solely for identification or informational purposes, without implying any affiliation, endorsement, or partnership.
We make no representations or warranties, express or implied, regarding the accuracy, completeness, or suitability of any content or products presented. Nothing on this website should be construed as legal, tax, investment, financial, medical, or other professional advice. In addition, no part of this site—including articles or product references—constitutes a solicitation, recommendation, endorsement, advertisement, or offer to buy or sell any securities, franchises, or other financial instruments, particularly in jurisdictions where such activity would be unlawful.
All content is of a general nature and may not address the specific circumstances of any individual or entity. It is not a substitute for professional advice or services. Any actions you take based on the information provided here are strictly at your own risk. You accept full responsibility for any decisions or outcomes arising from your use of this website and agree to release us from any liability in connection with your use of, or reliance upon, the content or products found herein.