
|
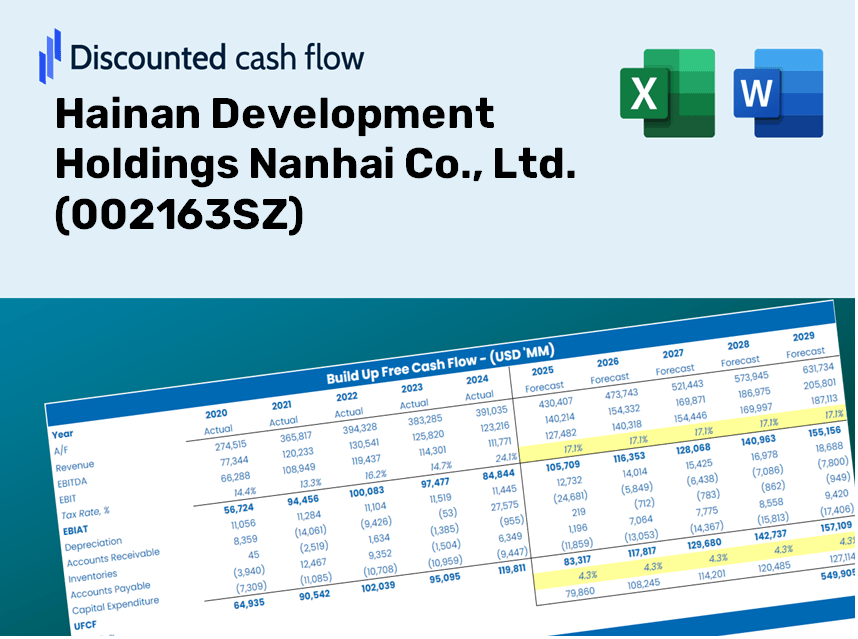
Hainan Development Holdings Nanhai Co., Ltd. (002163.SZ) DCF -Bewertung |
Fully Editable: Tailor To Your Needs In Excel Or Sheets
Professional Design: Trusted, Industry-Standard Templates
Investor-Approved Valuation Models
MAC/PC Compatible, Fully Unlocked
No Expertise Is Needed; Easy To Follow
Hainan Development Holdings Nanhai Co., Ltd. (002163.SZ) Bundle
Verbessern Sie Ihre Anlagestrategie mit dem DCF -Taschenrechner (002163SZ)! Verwenden Sie reale Finanzdaten von Hainan Development Holdings Nanhai Co., Ltd., stellen Sie Wachstumsprojektionen und -kosten an und beobachten Sie sofort, wie sich diese Modifikationen auf den inneren Wert von (002163SZ) auswirken.
What You Will Receive
- Authentic (002163SZ) Financial Data: Pre-loaded with Hainan Development Holdings Nanhai Co., Ltd.'s historical and projected figures for accurate analysis.
- Completely Customizable Template: Effortlessly adjust essential inputs like revenue growth, WACC, and EBITDA percentage.
- Instant Calculations: The intrinsic value of Hainan Development Holdings updates in real-time as you modify inputs.
- Professional Valuation Tool: Tailored for investors, analysts, and consultants aiming for reliable DCF outcomes.
- User-Friendly Interface: An intuitive layout and straightforward instructions suitable for users of all skill levels.
Key Features
- Authentic Financial Data for Hainan Development Holdings: Gain access to precise historical data and forward-looking projections for [002163SZ].
- Adjustable Forecast Parameters: Modify the yellow-highlighted fields, including WACC, growth rates, and profit margins.
- Real-Time Calculations: Enjoy automatic updates for DCF, Net Present Value (NPV), and cash flow evaluations.
- Interactive Dashboard: Utilize user-friendly charts and summaries to easily interpret your valuation findings.
- Designed for All Skill Levels: A straightforward, intuitive layout tailored for investors, CFOs, and consultants alike.
How It Works
- Step 1: Download the Excel file.
- Step 2: Examine the pre-filled data for Hainan Development Holdings Nanhai Co., Ltd. (002163SZ).
- Step 3: Modify key assumptions (highlighted in yellow) according to your analysis.
- Step 4: Observe automatic recalculations for the intrinsic value of Hainan Development Holdings Nanhai Co., Ltd. (002163SZ).
- Step 5: Utilize the results for making investment decisions or generating reports.
Why Select the Hainan Development Holdings Nanhai Co., Ltd. Calculator?
- Time-Efficient: Skip the hassle of building a DCF model from the ground up – it's ready for immediate use.
- Enhanced Precision: Dependable financial data and formulas minimize valuation errors.
- Completely Adjustable: Modify the model to align with your specific assumptions and forecasts.
- User-Friendly: Intuitive charts and outputs simplify result analysis.
- Endorsed by Professionals: Crafted for experts who prioritize accuracy and ease of use.
Who Can Benefit From This Product?
- Institutional Investors: Construct comprehensive and accurate valuation models for portfolio assessment in Hainan Development Holdings Nanhai Co., Ltd. (002163SZ).
- Corporate Finance Departments: Evaluate valuation scenarios to inform corporate strategies for Hainan Development Holdings Nanhai Co., Ltd. (002163SZ).
- Financial Consultants and Advisors: Deliver precise valuation analyses to clients interested in Hainan Development Holdings Nanhai Co., Ltd. (002163SZ).
- Students and Educators: Utilize actual market data to enhance financial modeling skills and educational practices related to Hainan Development Holdings Nanhai Co., Ltd. (002163SZ).
- Market Analysts: Gain insights into the valuation processes for companies like Hainan Development Holdings Nanhai Co., Ltd. (002163SZ).
Contents of the Template
- In-Depth DCF Model: Editable framework featuring comprehensive valuation calculations.
- Actual Financial Data: Hainan Development Holdings Nanhai Co., Ltd. [002163SZ] historical and projected financial information preloaded for thorough analysis.
- Adjustable Variables: Modify WACC, growth projections, and tax rates to explore various scenarios.
- Detailed Financial Statements: Complete annual and quarterly breakdowns for enhanced understanding.
- Essential Ratios: Integrated analysis covering profitability, efficiency, and leverage ratios.
- Interactive Dashboard with Visual Outputs: Visualizations and tables designed for clear, actionable insights.
Disclaimer
All information, articles, and product details provided on this website are for general informational and educational purposes only. We do not claim any ownership over, nor do we intend to infringe upon, any trademarks, copyrights, logos, brand names, or other intellectual property mentioned or depicted on this site. Such intellectual property remains the property of its respective owners, and any references here are made solely for identification or informational purposes, without implying any affiliation, endorsement, or partnership.
We make no representations or warranties, express or implied, regarding the accuracy, completeness, or suitability of any content or products presented. Nothing on this website should be construed as legal, tax, investment, financial, medical, or other professional advice. In addition, no part of this site—including articles or product references—constitutes a solicitation, recommendation, endorsement, advertisement, or offer to buy or sell any securities, franchises, or other financial instruments, particularly in jurisdictions where such activity would be unlawful.
All content is of a general nature and may not address the specific circumstances of any individual or entity. It is not a substitute for professional advice or services. Any actions you take based on the information provided here are strictly at your own risk. You accept full responsibility for any decisions or outcomes arising from your use of this website and agree to release us from any liability in connection with your use of, or reliance upon, the content or products found herein.