
|
Guangzhou Zhiguang Electric Co., Ltd. (002169.SZ) DCF -Bewertung |
Fully Editable: Tailor To Your Needs In Excel Or Sheets
Professional Design: Trusted, Industry-Standard Templates
Investor-Approved Valuation Models
MAC/PC Compatible, Fully Unlocked
No Expertise Is Needed; Easy To Follow
Guangzhou Zhiguang Electric Co., Ltd. (002169.SZ) Bundle
Entdecken Sie die finanzielle Zukunft von Guangzhou Zhiguang Electric Co., Ltd. (002169SZ) mit unserem benutzerfreundlichen DCF-Taschenrechner! Geben Sie Ihre Prognosen für Wachstum, Margen und Kosten ein, um den inneren Wert von Guangzhou Zhiguang Electric Co., Ltd. (002169SZ) zu berechnen, und verfeinern Sie Ihren Investitionsansatz.
Discounted Cash Flow (DCF) - (USD MM)
| Year | AY1 2020 |
AY2 2021 |
AY3 2022 |
AY4 2023 |
AY5 2024 |
FY1 2025 |
FY2 2026 |
FY3 2027 |
FY4 2028 |
FY5 2029 |
|---|---|---|---|---|---|---|---|---|---|---|
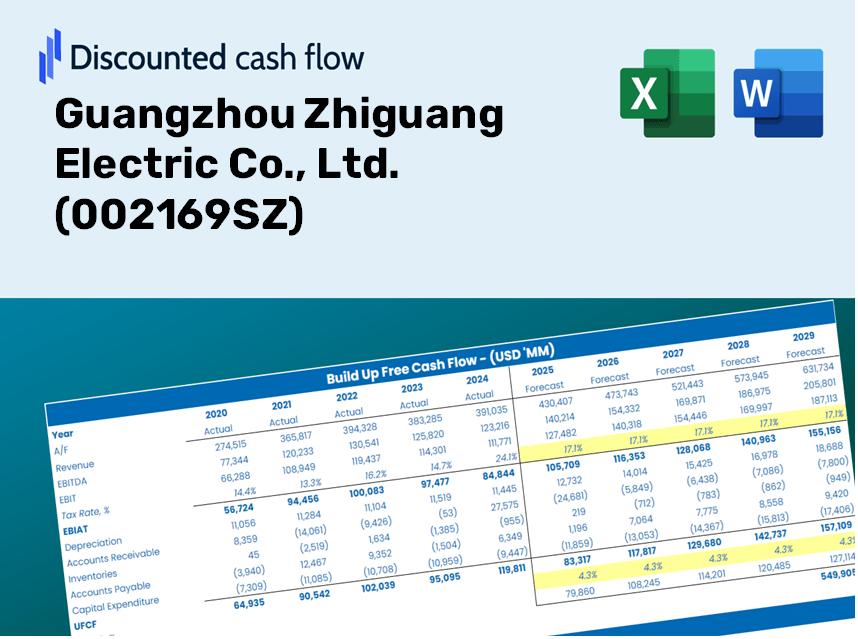
| Revenue | 2,142.6 | 1,889.2 | 2,352.0 | 2,734.1 | 2,595.9 | 2,750.8 | 2,914.9 | 3,088.8 | 3,273.1 | 3,468.3 |
| Revenue Growth, % | 0 | -11.83 | 24.5 | 16.25 | -5.05 | 5.97 | 5.97 | 5.97 | 5.97 | 5.97 |
| EBITDA | 519.2 | 554.9 | 303.0 | 31.5 | -69.6 | 357.4 | 378.7 | 401.3 | 425.2 | 450.6 |
| EBITDA, % | 24.23 | 29.37 | 12.88 | 1.15 | -2.68 | 12.99 | 12.99 | 12.99 | 12.99 | 12.99 |
| Depreciation | 178.4 | 170.1 | 163.9 | 153.5 | 181.8 | 203.1 | 215.2 | 228.1 | 241.7 | 256.1 |
| Depreciation, % | 8.33 | 9 | 6.97 | 5.61 | 7 | 7.38 | 7.38 | 7.38 | 7.38 | 7.38 |
| EBIT | 340.8 | 384.8 | 139.1 | -122.0 | -251.5 | 154.3 | 163.5 | 173.2 | 183.5 | 194.5 |
| EBIT, % | 15.91 | 20.37 | 5.91 | -4.46 | -9.69 | 5.61 | 5.61 | 5.61 | 5.61 | 5.61 |
| Total Cash | 550.4 | 489.9 | 772.5 | 1,016.3 | 880.3 | 855.8 | 906.8 | 960.9 | 1,018.2 | 1,079.0 |
| Total Cash, percent | .0 | .0 | .0 | .0 | .0 | .0 | .0 | .0 | .0 | .0 |
| Account Receivables | 1,686.5 | 1,532.7 | 1,616.6 | 2,047.7 | 1,984.4 | 2,090.1 | 2,214.8 | 2,347.0 | 2,487.0 | 2,635.4 |
| Account Receivables, % | 78.72 | 81.13 | 68.73 | 74.9 | 76.44 | 75.98 | 75.98 | 75.98 | 75.98 | 75.98 |
| Inventories | 452.9 | 540.8 | 505.0 | 601.4 | 678.0 | 656.6 | 695.8 | 737.3 | 781.3 | 827.9 |
| Inventories, % | 21.14 | 28.63 | 21.47 | 22 | 26.12 | 23.87 | 23.87 | 23.87 | 23.87 | 23.87 |
| Accounts Payable | 869.7 | 848.0 | 1,020.4 | 1,903.2 | 1,710.1 | 1,454.3 | 1,541.1 | 1,633.1 | 1,730.5 | 1,833.7 |
| Accounts Payable, % | 40.59 | 44.89 | 43.39 | 69.61 | 65.88 | 52.87 | 52.87 | 52.87 | 52.87 | 52.87 |
| Capital Expenditure | -84.8 | -82.4 | -198.3 | -994.3 | -1,026.2 | -509.7 | -540.1 | -572.3 | -606.5 | -642.7 |
| Capital Expenditure, % | -3.96 | -4.36 | -8.43 | -36.37 | -39.53 | -18.53 | -18.53 | -18.53 | -18.53 | -18.53 |
| Tax Rate, % | 9.32 | 9.32 | 9.32 | 9.32 | 9.32 | 9.32 | 9.32 | 9.32 | 9.32 | 9.32 |
| EBITAT | 306.1 | 393.4 | 53.9 | -102.2 | -228.0 | 124.3 | 131.8 | 139.6 | 148.0 | 156.8 |
| Depreciation | ||||||||||
| Changes in Account Receivables | ||||||||||
| Changes in Inventories | ||||||||||
| Changes in Accounts Payable | ||||||||||
| Capital Expenditure | ||||||||||
| UFCF | -870.0 | 525.5 | 143.8 | -587.8 | -1,278.8 | -522.4 | -270.2 | -286.3 | -303.4 | -321.5 |
| WACC, % | 8.03 | 8.17 | 7.37 | 7.96 | 8.05 | 7.91 | 7.91 | 7.91 | 7.91 | 7.91 |
| PV UFCF | ||||||||||
| SUM PV UFCF | -1,387.4 | |||||||||
| Long Term Growth Rate, % | 2.00 | |||||||||
| Free cash flow (T + 1) | -328 | |||||||||
| Terminal Value | -5,546 | |||||||||
| Present Terminal Value | -3,789 | |||||||||
| Enterprise Value | -5,177 | |||||||||
| Net Debt | 1,422 | |||||||||
| Equity Value | -6,599 | |||||||||
| Diluted Shares Outstanding, MM | 771 | |||||||||
| Equity Value Per Share | -8.56 |
What You Will Receive
- Genuine Guangzhou Zhiguang Data: Preloaded financials – including revenue and EBIT – sourced from actual and projected data.
- Comprehensive Customization: Modify all key parameters (yellow cells) such as WACC, growth %, and tax rates.
- Immediate Valuation Updates: Automatic recalculations to assess the effects of changes on Guangzhou Zhiguang’s fair value.
- Flexible Excel Template: Designed for rapid adjustments, scenario analysis, and in-depth projections.
- Efficient and Precise: Avoid the hassle of building models from scratch while ensuring accuracy and adaptability.
Key Features
- Pre-Loaded Data: Historical financial statements and pre-filled forecasts for Guangzhou Zhiguang Electric Co., Ltd. (002169SZ).
- Fully Adjustable Inputs: Modify WACC, tax rates, revenue growth, and EBITDA margins to suit your analysis.
- Instant Results: View the intrinsic value of Guangzhou Zhiguang Electric Co., Ltd. (002169SZ) recalculated in real time.
- Clear Visual Outputs: Dashboard charts that illustrate valuation results and essential metrics.
- Built for Accuracy: A professional-grade tool designed for analysts, investors, and finance professionals.
How It Works
- Download: Obtain the pre-formatted Excel file featuring Guangzhou Zhiguang Electric Co., Ltd.'s (002169SZ) financial data.
- Customize: Modify forecasts such as revenue growth, EBITDA %, and WACC to suit your analysis.
- Update Automatically: Watch as intrinsic value and NPV calculations refresh in real-time.
- Test Scenarios: Generate multiple projections and instantly compare the results.
- Make Decisions: Leverage the valuation outcomes to inform your investment strategy.
Why Choose This Calculator for Guangzhou Zhiguang Electric Co., Ltd. (002169SZ)?
- Designed for Experts: A sophisticated tool utilized by industry analysts, CFOs, and financial consultants.
- Up-to-Date Financial Data: Includes Guangzhou Zhiguang’s historical and projected financials for precise calculations.
- Flexible Scenario Analysis: Effortlessly model various forecasts and assumptions.
- Comprehensive Outputs: Automatically determines intrinsic value, NPV, and essential financial metrics.
- User-Friendly Experience: Detailed step-by-step instructions help you navigate the tool with ease.
Who Can Benefit from This Product?
- Professional Investors: Develop comprehensive and accurate valuation models for investment analysis of Guangzhou Zhiguang Electric Co., Ltd. (002169SZ).
- Corporate Finance Teams: Assess various valuation scenarios to inform strategic decisions within the organization.
- Consultants and Advisors: Equip clients with precise valuation insights related to Guangzhou Zhiguang Electric Co., Ltd. (002169SZ).
- Students and Educators: Utilize real-world data for practical learning and teaching in financial modeling.
- Tech Enthusiasts: Gain insights into how market valuations for technology firms like Guangzhou Zhiguang Electric Co., Ltd. (002169SZ) are determined.
Contents of the Template
- Operating and Balance Sheet Data: Pre-filled historical data and forecasts for Guangzhou Zhiguang Electric Co., Ltd. (002169SZ), including revenue, EBITDA, EBIT, and capital expenditures.
- WACC Calculation: A dedicated sheet for the Weighted Average Cost of Capital (WACC), featuring parameters such as Beta, risk-free rate, and share price.
- DCF Valuation (Unlevered and Levered): Customizable Discounted Cash Flow models detailing intrinsic value with comprehensive calculations.
- Financial Statements: Pre-loaded financial statements (annual and quarterly) to facilitate thorough analysis.
- Key Ratios: A collection of profitability, leverage, and efficiency ratios specific to Guangzhou Zhiguang Electric Co., Ltd. (002169SZ).
- Dashboard and Charts: Visual representations of valuation outputs and assumptions for easier result analysis.
Disclaimer
All information, articles, and product details provided on this website are for general informational and educational purposes only. We do not claim any ownership over, nor do we intend to infringe upon, any trademarks, copyrights, logos, brand names, or other intellectual property mentioned or depicted on this site. Such intellectual property remains the property of its respective owners, and any references here are made solely for identification or informational purposes, without implying any affiliation, endorsement, or partnership.
We make no representations or warranties, express or implied, regarding the accuracy, completeness, or suitability of any content or products presented. Nothing on this website should be construed as legal, tax, investment, financial, medical, or other professional advice. In addition, no part of this site—including articles or product references—constitutes a solicitation, recommendation, endorsement, advertisement, or offer to buy or sell any securities, franchises, or other financial instruments, particularly in jurisdictions where such activity would be unlawful.
All content is of a general nature and may not address the specific circumstances of any individual or entity. It is not a substitute for professional advice or services. Any actions you take based on the information provided here are strictly at your own risk. You accept full responsibility for any decisions or outcomes arising from your use of this website and agree to release us from any liability in connection with your use of, or reliance upon, the content or products found herein.