
|
Shenzhen TopraySolar Co., Ltd. (002218.sz) DCF -Bewertung |
Fully Editable: Tailor To Your Needs In Excel Or Sheets
Professional Design: Trusted, Industry-Standard Templates
Investor-Approved Valuation Models
MAC/PC Compatible, Fully Unlocked
No Expertise Is Needed; Easy To Follow
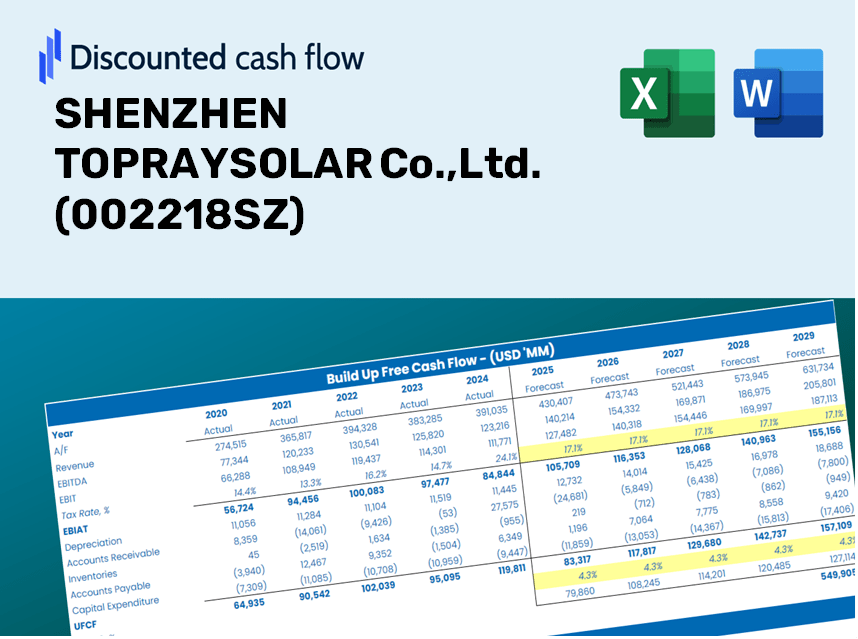
SHENZHEN TOPRAYSOLAR Co.,Ltd. (002218.SZ) Bundle
Bewerten Sie die finanzielle Aussichten von Shenzhen TopraySolar Co., Ltd. mit Fachwissen! Dieser DCF-Taschenrechner (002218SZ) bietet Ihnen vorgefüllte Finanzdaten und die Freiheit, das Umsatzwachstum, WACC, Margen und andere wesentliche Annahmen zu ändern, um sich mit Ihren Vorhersagen auszurichten.
Discounted Cash Flow (DCF) - (USD MM)
| Year | AY1 2020 |
AY2 2021 |
AY3 2022 |
AY4 2023 |
AY5 2024 |
FY1 2025 |
FY2 2026 |
FY3 2027 |
FY4 2028 |
FY5 2029 |
|---|---|---|---|---|---|---|---|---|---|---|
| Revenue | 1,360.5 | 1,423.7 | 1,322.9 | 1,127.0 | 1,321.7 | 1,321.9 | 1,322.0 | 1,322.1 | 1,322.2 | 1,322.3 |
| Revenue Growth, % | 0 | 4.64 | -7.08 | -14.8 | 17.28 | 0.00825505 | 0.00825505 | 0.00825505 | 0.00825505 | 0.00825505 |
| EBITDA | 636.0 | 670.6 | 533.9 | 413.7 | 422.0 | 536.3 | 536.3 | 536.4 | 536.4 | 536.4 |
| EBITDA, % | 46.75 | 47.1 | 40.36 | 36.71 | 31.93 | 40.57 | 40.57 | 40.57 | 40.57 | 40.57 |
| Depreciation | 315.8 | 322.9 | 309.0 | 308.1 | 335.9 | 322.5 | 322.6 | 322.6 | 322.6 | 322.6 |
| Depreciation, % | 23.21 | 22.68 | 23.36 | 27.34 | 25.41 | 24.4 | 24.4 | 24.4 | 24.4 | 24.4 |
| EBIT | 320.2 | 347.7 | 224.9 | 105.6 | 86.2 | 213.7 | 213.7 | 213.8 | 213.8 | 213.8 |
| EBIT, % | 23.54 | 24.42 | 17 | 9.37 | 6.52 | 16.17 | 16.17 | 16.17 | 16.17 | 16.17 |
| Total Cash | 510.6 | 1,130.2 | 1,465.3 | 702.6 | 782.0 | 894.7 | 894.8 | 894.8 | 894.9 | 895.0 |
| Total Cash, percent | .0 | .0 | .0 | .0 | .0 | .0 | .0 | .0 | .0 | .0 |
| Account Receivables | 1,505.2 | 1,188.4 | 1,076.9 | 1,249.8 | 1,408.8 | 1,229.0 | 1,229.1 | 1,229.2 | 1,229.3 | 1,229.4 |
| Account Receivables, % | 110.63 | 83.48 | 81.41 | 110.89 | 106.58 | 92.98 | 92.98 | 92.98 | 92.98 | 92.98 |
| Inventories | 352.8 | 401.1 | 502.0 | 467.1 | 398.6 | 432.6 | 432.7 | 432.7 | 432.7 | 432.8 |
| Inventories, % | 25.93 | 28.17 | 37.94 | 41.44 | 30.15 | 32.73 | 32.73 | 32.73 | 32.73 | 32.73 |
| Accounts Payable | 520.5 | 236.6 | 209.4 | 275.6 | 219.3 | 295.4 | 295.5 | 295.5 | 295.5 | 295.5 |
| Accounts Payable, % | 38.25 | 16.62 | 15.83 | 24.45 | 16.6 | 22.35 | 22.35 | 22.35 | 22.35 | 22.35 |
| Capital Expenditure | -196.7 | -204.5 | -167.5 | -256.1 | -281.4 | -226.0 | -226.1 | -226.1 | -226.1 | -226.1 |
| Capital Expenditure, % | -14.46 | -14.37 | -12.66 | -22.72 | -21.29 | -17.1 | -17.1 | -17.1 | -17.1 | -17.1 |
| Tax Rate, % | 52.99 | 52.99 | 52.99 | 52.99 | 52.99 | 52.99 | 52.99 | 52.99 | 52.99 | 52.99 |
| EBITAT | 267.4 | 334.3 | 184.7 | 92.6 | 40.5 | 169.5 | 169.5 | 169.6 | 169.6 | 169.6 |
| Depreciation | ||||||||||
| Changes in Account Receivables | ||||||||||
| Changes in Inventories | ||||||||||
| Changes in Accounts Payable | ||||||||||
| Capital Expenditure | ||||||||||
| UFCF | -951.0 | 437.3 | 309.6 | 72.9 | -51.7 | 487.8 | 265.9 | 266.0 | 266.0 | 266.0 |
| WACC, % | 9.63 | 9.76 | 9.61 | 9.67 | 9.25 | 9.58 | 9.58 | 9.58 | 9.58 | 9.58 |
| PV UFCF | ||||||||||
| SUM PV UFCF | 1,221.5 | |||||||||
| Long Term Growth Rate, % | 4.00 | |||||||||
| Free cash flow (T + 1) | 277 | |||||||||
| Terminal Value | 4,956 | |||||||||
| Present Terminal Value | 3,136 | |||||||||
| Enterprise Value | 4,358 | |||||||||
| Net Debt | 1,167 | |||||||||
| Equity Value | 3,191 | |||||||||
| Diluted Shares Outstanding, MM | 1,408 | |||||||||
| Equity Value Per Share | 2.27 |
Benefits of Choosing SHENZHEN TOPRAYSOLAR Co.,Ltd. (002218SZ)
- Comprehensive Financial Data: Access both historical and projected financial metrics for precise valuations.
- Customizable Parameters: Adjust WACC, tax rates, revenue growth, and capex according to your analysis needs.
- Dynamic Calculations: Automatically compute intrinsic value and NPV with real-time updates.
- Scenario Simulation: Explore various scenarios to assess the future outlook of SHENZHEN TOPRAYSOLAR Co.,Ltd.
- User-Friendly Interface: Designed for industry professionals, yet simple enough for newcomers to navigate.
Key Features
- Comprehensive Data Set: Access to SHENZHEN TOPRAYSOLAR's (002218SZ) past financial information and pre-populated forecasts.
- Customizable Parameters: Modify WACC, tax rates, revenue growth projections, and EBITDA margins as needed.
- Real-Time Insights: Watch SHENZHEN TOPRAYSOLAR's (002218SZ) intrinsic value update dynamically.
- Intuitive Visual Outputs: Interactive dashboard charts showcase valuation outcomes and important metrics.
- Designed for Precision: A reliable tool tailored for analysts, investors, and finance professionals.
How It Works
- Step 1: Download the Excel file.
- Step 2: Review Shenzhen Topray Solar's pre-filled financial data and projections.
- Step 3: Adjust key parameters such as revenue growth, WACC, and tax rates (highlighted cells).
- Step 4: Observe the DCF model refresh in real-time as you modify your inputs.
- Step 5: Examine the results and leverage them for your investment strategies.
Why Choose SHENZHEN TOPRAYSOLAR Co., Ltd. (002218SZ) Calculator?
- Precision: Utilizes authentic SHENZHEN TOPRAYSOLAR financial data for reliable calculations.
- Adaptability: Crafted to allow users to easily adjust and experiment with different inputs.
- Efficiency: Eliminate the need to construct a financial model from the ground up.
- Corporate-Quality: Engineered with the expertise and usability expected by top financial executives.
- Accessible: Simple to navigate, making it suitable for individuals without specialized financial modeling skills.
Who Can Benefit from This Product?
- Institutional Investors: Create comprehensive and trustworthy valuation models for your investment strategies in SHENZHEN TOPRAYSOLAR (002218SZ).
- Corporate Finance Departments: Evaluate various valuation scenarios to inform your company's financial planning.
- Consultants and Financial Advisors: Deliver precise valuation analyses for clients interested in SHENZHEN TOPRAYSOLAR (002218SZ).
- Students and Academic Professionals: Utilize authentic market data for hands-on learning and teaching of financial modeling techniques.
- Renewable Energy Enthusiasts: Gain insights into how solar companies like SHENZHEN TOPRAYSOLAR (002218SZ) are appraised in the marketplace.
Contents of the Template
- Operating and Balance Sheet Data: Pre-filled historical data and forecasts for SHENZHEN TOPRAYSOLAR Co., Ltd. (002218SZ), including revenue, EBITDA, EBIT, and capital expenditures.
- WACC Calculation: A dedicated sheet for calculating the Weighted Average Cost of Capital (WACC), featuring parameters such as Beta, risk-free rate, and share price.
- DCF Valuation (Unlevered and Levered): Customizable Discounted Cash Flow models presenting intrinsic value with comprehensive calculations.
- Financial Statements: Pre-loaded financial statements (annual and quarterly) to facilitate thorough analysis.
- Key Ratios: Includes profitability, leverage, and efficiency ratios relevant to SHENZHEN TOPRAYSOLAR Co., Ltd. (002218SZ).
- Dashboard and Charts: A visual overview of valuation outputs and assumptions, making it easy to analyze results.
Disclaimer
All information, articles, and product details provided on this website are for general informational and educational purposes only. We do not claim any ownership over, nor do we intend to infringe upon, any trademarks, copyrights, logos, brand names, or other intellectual property mentioned or depicted on this site. Such intellectual property remains the property of its respective owners, and any references here are made solely for identification or informational purposes, without implying any affiliation, endorsement, or partnership.
We make no representations or warranties, express or implied, regarding the accuracy, completeness, or suitability of any content or products presented. Nothing on this website should be construed as legal, tax, investment, financial, medical, or other professional advice. In addition, no part of this site—including articles or product references—constitutes a solicitation, recommendation, endorsement, advertisement, or offer to buy or sell any securities, franchises, or other financial instruments, particularly in jurisdictions where such activity would be unlawful.
All content is of a general nature and may not address the specific circumstances of any individual or entity. It is not a substitute for professional advice or services. Any actions you take based on the information provided here are strictly at your own risk. You accept full responsibility for any decisions or outcomes arising from your use of this website and agree to release us from any liability in connection with your use of, or reliance upon, the content or products found herein.