
|
Castech Inc. (002222.sz) DCF -Bewertung |
Fully Editable: Tailor To Your Needs In Excel Or Sheets
Professional Design: Trusted, Industry-Standard Templates
Investor-Approved Valuation Models
MAC/PC Compatible, Fully Unlocked
No Expertise Is Needed; Easy To Follow
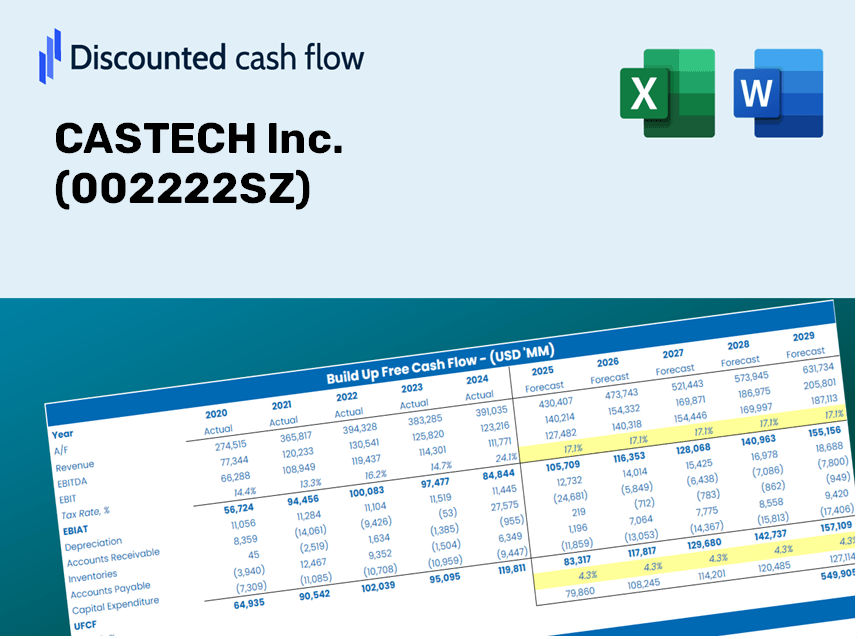
CASTECH Inc. (002222.SZ) Bundle
Bewerten Sie den finanziellen Ausblick von Castech Inc. wie ein Experte! Dieser DCF-Taschenrechner (002222SZ) bietet Ihnen vorgefüllte Finanzdaten und die Flexibilität, das Umsatzwachstum, WACC, Margen und andere wesentliche Annahmen zu ändern, um sich an Ihren Projektionen auszurichten.
Discounted Cash Flow (DCF) - (USD MM)
| Year | AY1 2020 |
AY2 2021 |
AY3 2022 |
AY4 2023 |
AY5 2024 |
FY1 2025 |
FY2 2026 |
FY3 2027 |
FY4 2028 |
FY5 2029 |
|---|---|---|---|---|---|---|---|---|---|---|
| Revenue | 546.5 | 688.7 | 768.4 | 781.6 | 875.7 | 988.2 | 1,115.0 | 1,258.2 | 1,419.8 | 1,602.1 |
| Revenue Growth, % | 0 | 26.03 | 11.57 | 1.73 | 12.04 | 12.84 | 12.84 | 12.84 | 12.84 | 12.84 |
| EBITDA | 194.4 | 244.5 | 276.3 | 255.9 | 305.9 | 345.3 | 389.6 | 439.6 | 496.1 | 559.8 |
| EBITDA, % | 35.58 | 35.49 | 35.96 | 32.74 | 34.93 | 34.94 | 34.94 | 34.94 | 34.94 | 34.94 |
| Depreciation | 44.9 | 46.6 | 44.8 | 51.9 | 65.3 | 69.0 | 77.9 | 87.9 | 99.2 | 111.9 |
| Depreciation, % | 8.22 | 6.77 | 5.83 | 6.65 | 7.45 | 6.98 | 6.98 | 6.98 | 6.98 | 6.98 |
| EBIT | 149.5 | 197.8 | 231.5 | 204.0 | 240.6 | 276.2 | 311.7 | 351.7 | 396.9 | 447.9 |
| EBIT, % | 27.36 | 28.72 | 30.12 | 26.1 | 27.47 | 27.96 | 27.96 | 27.96 | 27.96 | 27.96 |
| Total Cash | 253.0 | 293.5 | 416.9 | 345.0 | 321.2 | 442.7 | 499.5 | 563.6 | 636.0 | 717.7 |
| Total Cash, percent | .0 | .0 | .0 | .0 | .0 | .0 | .0 | .0 | .0 | .0 |
| Account Receivables | 226.8 | 318.5 | 311.0 | 367.5 | 446.6 | 447.1 | 504.5 | 569.3 | 642.4 | 724.9 |
| Account Receivables, % | 41.51 | 46.24 | 40.48 | 47.01 | 51 | 45.25 | 45.25 | 45.25 | 45.25 | 45.25 |
| Inventories | 184.9 | 192.1 | 200.6 | 229.5 | 288.4 | 296.7 | 334.8 | 377.8 | 426.3 | 481.1 |
| Inventories, % | 33.84 | 27.89 | 26.11 | 29.36 | 32.93 | 30.03 | 30.03 | 30.03 | 30.03 | 30.03 |
| Accounts Payable | 33.7 | 40.6 | 54.0 | 62.7 | 64.8 | 68.2 | 77.0 | 86.9 | 98.0 | 110.6 |
| Accounts Payable, % | 6.17 | 5.9 | 7.03 | 8.03 | 7.4 | 6.9 | 6.9 | 6.9 | 6.9 | 6.9 |
| Capital Expenditure | -36.3 | -76.9 | -119.9 | -209.9 | -212.0 | -167.0 | -188.4 | -212.6 | -239.9 | -270.7 |
| Capital Expenditure, % | -6.64 | -11.17 | -15.6 | -26.85 | -24.21 | -16.9 | -16.9 | -16.9 | -16.9 | -16.9 |
| Tax Rate, % | 13.97 | 13.97 | 13.97 | 13.97 | 13.97 | 13.97 | 13.97 | 13.97 | 13.97 | 13.97 |
| EBITAT | 128.8 | 172.4 | 196.9 | 184.7 | 207.0 | 240.3 | 271.2 | 306.0 | 345.3 | 389.6 |
| Depreciation | ||||||||||
| Changes in Account Receivables | ||||||||||
| Changes in Inventories | ||||||||||
| Changes in Accounts Payable | ||||||||||
| Capital Expenditure | ||||||||||
| UFCF | -240.6 | 50.2 | 134.0 | -49.8 | -75.8 | 137.0 | 73.9 | 83.4 | 94.1 | 106.2 |
| WACC, % | 5.48 | 5.48 | 5.48 | 5.48 | 5.48 | 5.48 | 5.48 | 5.48 | 5.48 | 5.48 |
| PV UFCF | ||||||||||
| SUM PV UFCF | 424.7 | |||||||||
| Long Term Growth Rate, % | 4.00 | |||||||||
| Free cash flow (T + 1) | 110 | |||||||||
| Terminal Value | 7,479 | |||||||||
| Present Terminal Value | 5,729 | |||||||||
| Enterprise Value | 6,154 | |||||||||
| Net Debt | -214 | |||||||||
| Equity Value | 6,368 | |||||||||
| Diluted Shares Outstanding, MM | 470 | |||||||||
| Equity Value Per Share | 13.54 |
What You Will Receive
- Actual CASTECH Data: Preloaded financial information – including revenue and EBIT – based on real and forecasted figures.
- Complete Customization: Modify all key parameters (yellow cells) such as WACC, growth %, and tax rates.
- Immediate Valuation Updates: Automatic recalculations to assess the effects of changes on CASTECH’s (002222SZ) fair value.
- Flexible Excel Template: Designed for quick modifications, scenario analysis, and comprehensive projections.
- Efficient and Precise: Avoid the hassle of building models from scratch while ensuring accuracy and adaptability.
Key Features
- Comprehensive DCF Calculator: Offers detailed unlevered and levered DCF valuation models tailored for CASTECH Inc. (002222SZ).
- WACC Calculator: Equipped with a pre-configured Weighted Average Cost of Capital sheet featuring customizable input options.
- Customizable Forecast Assumptions: Easily adjust growth rates, capital expenditures, and discount rates as needed.
- Integrated Financial Ratios: Assess profitability, leverage, and efficiency ratios specific to CASTECH Inc. (002222SZ).
- Interactive Dashboard and Visualizations: Dynamic outputs provide a summary of key valuation metrics for streamlined analysis.
How It Works
- Step 1: Download the Excel file for CASTECH Inc. (002222SZ).
- Step 2: Review the pre-filled CASTECH data (historical and projected).
- Step 3: Modify key assumptions (highlighted in yellow) based on your insights.
- Step 4: Observe the automatic recalculations for CASTECH's intrinsic value.
- Step 5: Utilize the results for your investment strategies or reporting needs.
Why Opt for CASTECH Inc. Calculator?
- User-Friendly Interface: Perfect for both novices and seasoned users.
- Customizable Inputs: Adjust parameters effortlessly to fit your analysis needs.
- Real-Time Updates: Watch CASTECH’s valuation change instantaneously as you modify inputs.
- Preloaded Data: Comes equipped with CASTECH's actual financial figures for immediate analysis.
- Relied Upon by Experts: Favored by investors and analysts to make well-informed choices.
Who Can Benefit from CASTECH Inc.?
- Individual Investors: Make well-informed choices regarding the purchase or sale of CASTECH Inc. (002222SZ) stocks.
- Financial Analysts: Enhance valuation processes with comprehensive financial models tailored for CASTECH Inc. (002222SZ).
- Consultants: Provide clients with accurate and timely valuation insights for CASTECH Inc. (002222SZ).
- Business Owners: Gain insights into how companies like CASTECH Inc. (002222SZ) are valued to inform your own business strategies.
- Finance Students: Acquire practical valuation skills by analyzing real-world data related to CASTECH Inc. (002222SZ).
What the Template Contains
- Historical Data: Features CASTECH Inc. (002222SZ)'s previous financials and foundational forecasts.
- DCF and Levered DCF Models: Comprehensive templates for calculating the intrinsic value of CASTECH Inc. (002222SZ).
- WACC Sheet: Pre-configured calculations for the Weighted Average Cost of Capital.
- Editable Inputs: Adjust crucial variables such as growth rates, EBITDA %, and CAPEX predictions.
- Quarterly and Annual Statements: Thorough analysis of CASTECH Inc. (002222SZ)'s financial performance.
- Interactive Dashboard: Dynamically visualize valuation results and forecasts.
Disclaimer
All information, articles, and product details provided on this website are for general informational and educational purposes only. We do not claim any ownership over, nor do we intend to infringe upon, any trademarks, copyrights, logos, brand names, or other intellectual property mentioned or depicted on this site. Such intellectual property remains the property of its respective owners, and any references here are made solely for identification or informational purposes, without implying any affiliation, endorsement, or partnership.
We make no representations or warranties, express or implied, regarding the accuracy, completeness, or suitability of any content or products presented. Nothing on this website should be construed as legal, tax, investment, financial, medical, or other professional advice. In addition, no part of this site—including articles or product references—constitutes a solicitation, recommendation, endorsement, advertisement, or offer to buy or sell any securities, franchises, or other financial instruments, particularly in jurisdictions where such activity would be unlawful.
All content is of a general nature and may not address the specific circumstances of any individual or entity. It is not a substitute for professional advice or services. Any actions you take based on the information provided here are strictly at your own risk. You accept full responsibility for any decisions or outcomes arising from your use of this website and agree to release us from any liability in connection with your use of, or reliance upon, the content or products found herein.