
|
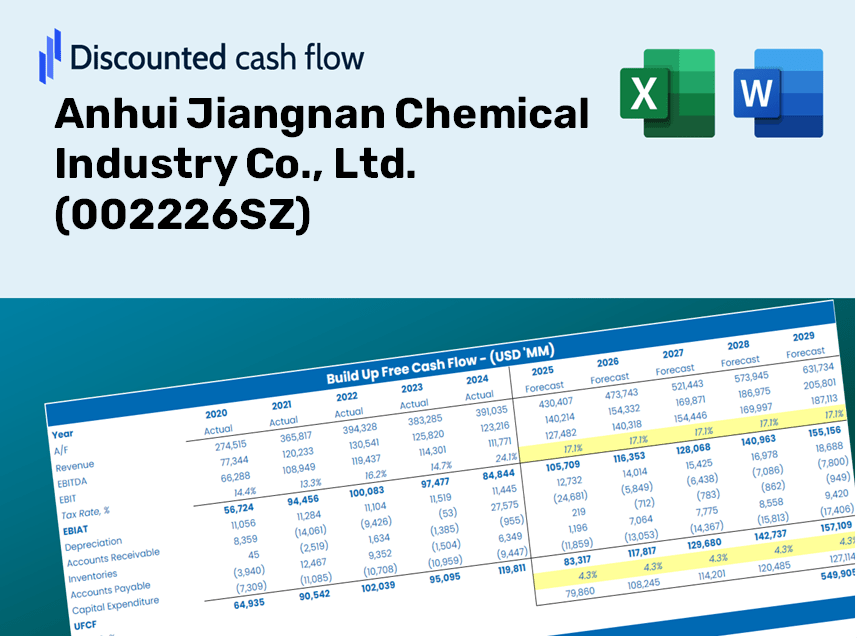
Anhui Jiangnan Chemical Industry Co., Ltd. (002226.sz) DCF -Bewertung |
Fully Editable: Tailor To Your Needs In Excel Or Sheets
Professional Design: Trusted, Industry-Standard Templates
Investor-Approved Valuation Models
MAC/PC Compatible, Fully Unlocked
No Expertise Is Needed; Easy To Follow
Anhui Jiangnan Chemical Industry Co., Ltd. (002226.SZ) Bundle
Wenn Sie ein Investor oder Analyst sind, ist dieser DCF -Taschenrechner (002226SZ) das perfekte Werkzeug für eine genaue Bewertung. Es wird mit echten Daten von Anhui Jiangnan Chemical Industry Co., Ltd., vorgeladen, sodass Sie die Prognosen anpassen und sofort die Auswirkungen beobachten können.
Discounted Cash Flow (DCF) - (USD MM)
| Year | AY1 2020 |
AY2 2021 |
AY3 2022 |
AY4 2023 |
AY5 2024 |
FY1 2025 |
FY2 2026 |
FY3 2027 |
FY4 2028 |
FY5 2029 |
|---|---|---|---|---|---|---|---|---|---|---|
| Revenue | 3,918.8 | 6,481.1 | 7,819.4 | 8,894.8 | 9,480.7 | 9,889.8 | 10,316.5 | 10,761.6 | 11,226.0 | 11,710.4 |
| Revenue Growth, % | 0 | 65.39 | 20.65 | 13.75 | 6.59 | 4.31 | 4.31 | 4.31 | 4.31 | 4.31 |
| EBITDA | 1,349.0 | 1,777.7 | 1,722.8 | 2,035.2 | 2,068.6 | 2,543.4 | 2,653.1 | 2,767.6 | 2,887.0 | 3,011.5 |
| EBITDA, % | 34.42 | 27.43 | 22.03 | 22.88 | 21.82 | 25.72 | 25.72 | 25.72 | 25.72 | 25.72 |
| Depreciation | 453.4 | 514.3 | 594.9 | 630.1 | 648.1 | 811.7 | 846.7 | 883.2 | 921.3 | 961.1 |
| Depreciation, % | 11.57 | 7.94 | 7.61 | 7.08 | 6.84 | 8.21 | 8.21 | 8.21 | 8.21 | 8.21 |
| EBIT | 895.5 | 1,263.4 | 1,128.0 | 1,405.1 | 1,420.5 | 1,731.7 | 1,806.4 | 1,884.4 | 1,965.7 | 2,050.5 |
| EBIT, % | 22.85 | 19.49 | 14.43 | 15.8 | 14.98 | 17.51 | 17.51 | 17.51 | 17.51 | 17.51 |
| Total Cash | 1,243.6 | 2,174.3 | 2,556.3 | 2,226.4 | 2,290.7 | 2,910.9 | 3,036.5 | 3,167.5 | 3,304.2 | 3,446.8 |
| Total Cash, percent | .0 | .0 | .0 | .0 | .0 | .0 | .0 | .0 | .0 | .0 |
| Account Receivables | 2,403.8 | 3,400.0 | 3,432.5 | 4,099.5 | 5,166.1 | 5,108.6 | 5,329.1 | 5,559.0 | 5,798.8 | 6,049.1 |
| Account Receivables, % | 61.34 | 52.46 | 43.9 | 46.09 | 54.49 | 51.66 | 51.66 | 51.66 | 51.66 | 51.66 |
| Inventories | 191.4 | 393.6 | 478.5 | 586.9 | 813.3 | 637.9 | 665.5 | 694.2 | 724.1 | 755.4 |
| Inventories, % | 4.88 | 6.07 | 6.12 | 6.6 | 8.58 | 6.45 | 6.45 | 6.45 | 6.45 | 6.45 |
| Accounts Payable | 812.7 | 688.8 | 1,138.9 | 1,253.5 | 1,487.8 | 1,497.7 | 1,562.3 | 1,629.7 | 1,700.0 | 1,773.4 |
| Accounts Payable, % | 20.74 | 10.63 | 14.57 | 14.09 | 15.69 | 15.14 | 15.14 | 15.14 | 15.14 | 15.14 |
| Capital Expenditure | -269.1 | -405.3 | -590.8 | -752.8 | -507.8 | -682.3 | -711.8 | -742.5 | -774.5 | -807.9 |
| Capital Expenditure, % | -6.87 | -6.25 | -7.56 | -8.46 | -5.36 | -6.9 | -6.9 | -6.9 | -6.9 | -6.9 |
| Tax Rate, % | 36.74 | 36.74 | 36.74 | 36.74 | 36.74 | 36.74 | 36.74 | 36.74 | 36.74 | 36.74 |
| EBITAT | 594.4 | 928.9 | 596.8 | 882.5 | 898.7 | 1,104.4 | 1,152.1 | 1,201.8 | 1,253.6 | 1,307.7 |
| Depreciation | ||||||||||
| Changes in Account Receivables | ||||||||||
| Changes in Inventories | ||||||||||
| Changes in Accounts Payable | ||||||||||
| Capital Expenditure | ||||||||||
| UFCF | -1,003.7 | -284.3 | 933.6 | 98.9 | -19.7 | 1,476.5 | 1,103.7 | 1,151.3 | 1,201.0 | 1,252.8 |
| WACC, % | 4.9 | 4.95 | 4.81 | 4.88 | 4.88 | 4.89 | 4.89 | 4.89 | 4.89 | 4.89 |
| PV UFCF | ||||||||||
| SUM PV UFCF | 5,388.0 | |||||||||
| Long Term Growth Rate, % | 3.00 | |||||||||
| Free cash flow (T + 1) | 1,290 | |||||||||
| Terminal Value | 68,403 | |||||||||
| Present Terminal Value | 53,886 | |||||||||
| Enterprise Value | 59,274 | |||||||||
| Net Debt | 2,186 | |||||||||
| Equity Value | 57,088 | |||||||||
| Diluted Shares Outstanding, MM | 2,649 | |||||||||
| Equity Value Per Share | 21.55 |
Benefits of Choosing Us
- Prepared Financial Model: Access to Anhui Jiangnan Chemical's actual data for accurate DCF valuation.
- Comprehensive Forecast Control: Modify revenue growth, profit margins, WACC, and other critical metrics.
- Immediate Calculations: Real-time updates allow you to view results instantly as you adjust parameters.
- Professional-Quality Template: A polished Excel file crafted for high-standard valuations.
- Flexible and Reusable: Designed for adaptability, enabling consistent use for in-depth forecasts.
Key Features
- Authentic Financial Data for Anhui Jiangnan: Gain access to reliable, pre-loaded historical performance metrics and future forecasts.
- Adjustable Forecast Parameters: Modify highlighted fields such as WACC, growth rates, and profit margins to suit your analysis.
- Real-Time Calculations: Instant updates on DCF, Net Present Value (NPV), and cash flow assessments.
- Intuitive Visual Dashboard: Clear charts and summaries to help you easily interpret valuation outcomes.
- Designed for All Users: An accessible and user-friendly layout tailored for investors, CFOs, and consultants alike.
How It Works
- Step 1: Download the Excel file.
- Step 2: Review Anhui Jiangnan Chemical Industry Co., Ltd.'s pre-filled financial data and projections.
- Step 3: Adjust key inputs such as revenue growth, WACC, and tax rates (highlighted cells).
- Step 4: Observe how the DCF model updates in real-time as you modify your assumptions.
- Step 5: Evaluate the outputs and leverage the results for informed investment decisions related to (002226SZ).
Why Opt for This Calculator for Anhui Jiangnan Chemical Industry Co., Ltd. (002226SZ)?
- Tailored for Experts: A sophisticated tool designed for analysts, finance executives, and industry consultants.
- Accurate Historical Data: Preloaded financial data for Anhui Jiangnan Chemical Industry ensures precise analysis.
- Flexible Scenario Analysis: Effortlessly test various projections and assumptions.
- Comprehensive Results: Automatically calculates intrinsic value, NPV, and other essential metrics.
- User-Friendly Interface: Step-by-step guidance makes navigation simple and efficient.
Who Can Benefit from This Product?
- Investors: Assess the valuation of Anhui Jiangnan Chemical Industry Co., Ltd. (002226SZ) before making investment decisions.
- CFOs and Financial Analysts: Optimize valuation processes and validate financial projections.
- Startup Founders: Gain insights into how established companies like Anhui Jiangnan Chemical Industry Co., Ltd. (002226SZ) are valued.
- Consultants: Provide comprehensive valuation reports for your clients.
- Students and Educators: Utilize real-world data to explore and teach valuation methodologies.
Contents of the Template
- Pre-Filled DCF Model: Anhui Jiangnan Chemical Industry Co., Ltd.'s (002226SZ) financial data preloaded for immediate use.
- WACC Calculator: Detailed calculations for Weighted Average Cost of Capital.
- Financial Ratios: Assess Anhui Jiangnan's profitability, leverage, and efficiency.
- Editable Inputs: Modify assumptions such as growth rates, margins, and CAPEX to suit your scenarios.
- Financial Statements: Annual and quarterly reports for comprehensive analysis.
- Interactive Dashboard: Easily visualize key valuation metrics and results.
Disclaimer
All information, articles, and product details provided on this website are for general informational and educational purposes only. We do not claim any ownership over, nor do we intend to infringe upon, any trademarks, copyrights, logos, brand names, or other intellectual property mentioned or depicted on this site. Such intellectual property remains the property of its respective owners, and any references here are made solely for identification or informational purposes, without implying any affiliation, endorsement, or partnership.
We make no representations or warranties, express or implied, regarding the accuracy, completeness, or suitability of any content or products presented. Nothing on this website should be construed as legal, tax, investment, financial, medical, or other professional advice. In addition, no part of this site—including articles or product references—constitutes a solicitation, recommendation, endorsement, advertisement, or offer to buy or sell any securities, franchises, or other financial instruments, particularly in jurisdictions where such activity would be unlawful.
All content is of a general nature and may not address the specific circumstances of any individual or entity. It is not a substitute for professional advice or services. Any actions you take based on the information provided here are strictly at your own risk. You accept full responsibility for any decisions or outcomes arising from your use of this website and agree to release us from any liability in connection with your use of, or reliance upon, the content or products found herein.