
|
Peking Orientaler Yuhong Water of Technology Co., Ltd. (002271.sz) DCF -Bewertung |
Fully Editable: Tailor To Your Needs In Excel Or Sheets
Professional Design: Trusted, Industry-Standard Templates
Investor-Approved Valuation Models
MAC/PC Compatible, Fully Unlocked
No Expertise Is Needed; Easy To Follow
Beijing Oriental Yuhong Waterproof Technology Co., Ltd. (002271.SZ) Bundle
Vereinfachen Sie die Bewertung von Peking orientalisch Yuhong Water of Technology Co., Ltd. (002271SZ) mit diesem anpassbaren DCF -Taschenrechner! Mit echten Peking -orientalischen Yuhong -Finanzdaten und einstellbaren Prognoseeingaben können Sie Szenarien testen und den beizulegenden Zeitwert von Peking orientalisch in Minuten aufdecken.
Benefits You'll Receive
- Authentic 002271 Financials: Access to both historical and projected data for precise valuation.
- Customizable Inputs: Adjust WACC, tax rates, revenue growth, and capital expenditures as needed.
- Automated Calculations: Dynamic computation of intrinsic value and NPV for seamless analysis.
- Scenario Analysis: Evaluate various scenarios to assess the future performance of Beijing Oriental Yuhong.
- User-Friendly and Intuitive Design: Designed for industry professionals while remaining accessible to newcomers.
Key Features
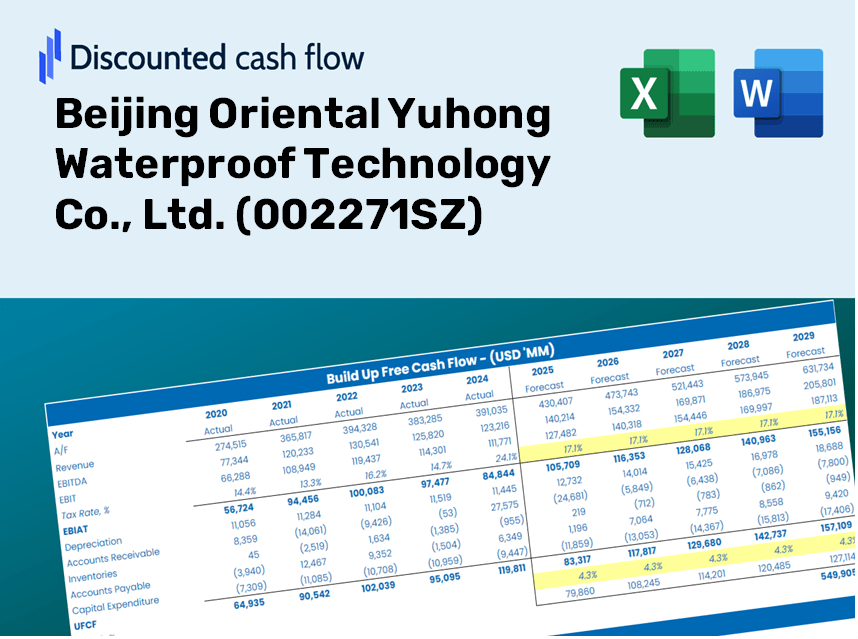
- Authentic Financial Data for Beijing Oriental Yuhong: Gain access to precise pre-loaded historical figures and future forecasts.
- Tailorable Forecast Parameters: Modify the highlighted cells for WACC, growth rates, and profit margins.
- Automated Calculations: Real-time updates for DCF, Net Present Value (NPV), and cash flow assessments.
- User-Friendly Dashboard: Intuitive graphs and summaries to effectively display your valuation findings.
- Designed for All Experience Levels: An uncomplicated, user-centric layout suitable for investors, CFOs, and consultants alike.
How It Works
- Download the Template: Gain immediate access to the Excel-based B.O.Y. Waterproof DCF Calculator.
- Input Your Assumptions: Modify the yellow-highlighted fields for growth rates, WACC, profit margins, and additional variables.
- Instant Calculations: The model automatically recalculates the intrinsic value of Beijing Oriental Yuhong Waterproof Technology Co., Ltd. (002271SZ).
- Test Scenarios: Explore various assumptions to see how they impact valuation outcomes.
- Analyze and Decide: Utilize the findings to inform your investment strategies or financial assessments.
Why Choose Beijing Oriental Yuhong Waterproof Technology Co., Ltd. (002271SZ)?
- Time-Saving: Skip the hassle of building a waterproofing solution from the ground up – we offer ready-to-use products.
- Enhanced Reliability: Our high-quality materials and proven technology minimize the risk of failure.
- Fully Customizable Solutions: Adapt our products to meet your specific waterproofing needs and project requirements.
- User-Friendly: Intuitive designs and detailed guidelines make our products straightforward to implement.
- Endorsed by Industry Leaders: Trusted by professionals who prioritize quality and effectiveness in waterproofing.
Who Can Benefit from This Product?
- Professional Investors: Develop comprehensive and trustworthy valuation models for analyzing portfolios involving Beijing Oriental Yuhong Waterproof Technology Co., Ltd. (002271SZ).
- Corporate Finance Teams: Assess valuation scenarios to inform strategic decisions within the organization.
- Consultants and Advisors: Equip clients with precise valuation insights regarding the stock of Beijing Oriental Yuhong Waterproof Technology Co., Ltd. (002271SZ).
- Students and Educators: Utilize real market data to practice and instruct on financial modeling techniques.
- Industry Enthusiasts: Gain insights into how companies like Beijing Oriental Yuhong Waterproof Technology Co., Ltd. (002271SZ) are valued in the industry.
Contents of the Template
- Preloaded 002271SZ Data: Historical and projected financial figures, such as revenue, EBIT, and capital investments.
- DCF and WACC Models: High-quality spreadsheets designed for determining intrinsic value and Weighted Average Cost of Capital.
- Editable Inputs: Cells highlighted in yellow for modifying revenue growth rates, tax rates, and discount factors.
- Financial Statements: Detailed annual and quarterly financial reports for thorough analysis.
- Key Ratios: Metrics of profitability, leverage, and efficiency to assess performance.
- Dashboard and Charts: Visual representations of valuation results and underlying assumptions.
Disclaimer
All information, articles, and product details provided on this website are for general informational and educational purposes only. We do not claim any ownership over, nor do we intend to infringe upon, any trademarks, copyrights, logos, brand names, or other intellectual property mentioned or depicted on this site. Such intellectual property remains the property of its respective owners, and any references here are made solely for identification or informational purposes, without implying any affiliation, endorsement, or partnership.
We make no representations or warranties, express or implied, regarding the accuracy, completeness, or suitability of any content or products presented. Nothing on this website should be construed as legal, tax, investment, financial, medical, or other professional advice. In addition, no part of this site—including articles or product references—constitutes a solicitation, recommendation, endorsement, advertisement, or offer to buy or sell any securities, franchises, or other financial instruments, particularly in jurisdictions where such activity would be unlawful.
All content is of a general nature and may not address the specific circumstances of any individual or entity. It is not a substitute for professional advice or services. Any actions you take based on the information provided here are strictly at your own risk. You accept full responsibility for any decisions or outcomes arising from your use of this website and agree to release us from any liability in connection with your use of, or reliance upon, the content or products found herein.