
|
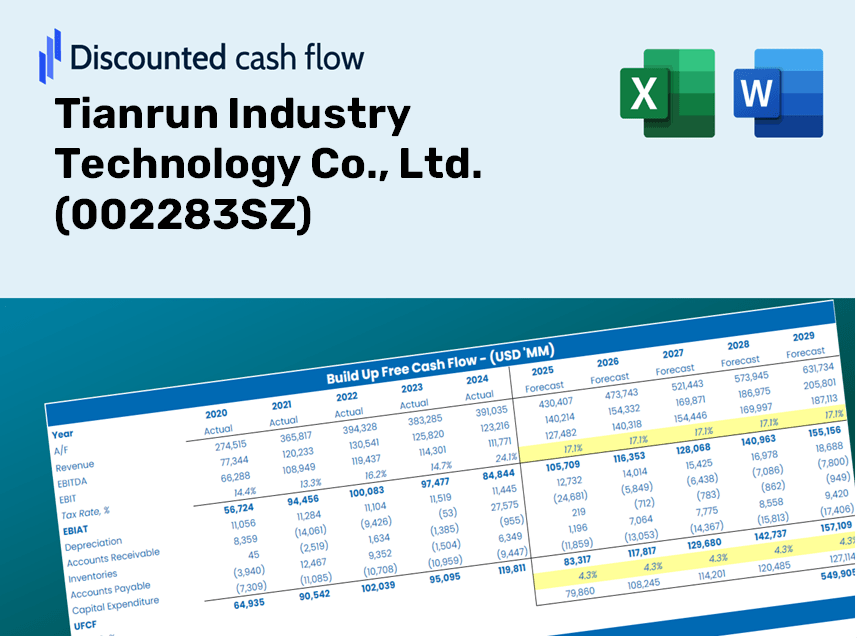
Tianrun Industry Technology Co., Ltd. (002283.SZ) DCF -Bewertung |
Fully Editable: Tailor To Your Needs In Excel Or Sheets
Professional Design: Trusted, Industry-Standard Templates
Investor-Approved Valuation Models
MAC/PC Compatible, Fully Unlocked
No Expertise Is Needed; Easy To Follow
Tianrun Industry Technology Co., Ltd. (002283.SZ) Bundle
Optimieren Sie Ihre Analyse und verbessern Sie die Präzision mit unserem DCF -Taschenrechner (002283SZ)! Durch die Verwendung realer Daten von Tianrun Industry Technology Co., Ltd. und anpassbaren Annahmen ermöglichen dieses Tool Sie, wie ein erfahrener Investor prognostiziert, analysieren und value (002283SZ).
Discounted Cash Flow (DCF) - (USD MM)
| Year | AY1 2020 |
AY2 2021 |
AY3 2022 |
AY4 2023 |
AY5 2024 |
FY1 2025 |
FY2 2026 |
FY3 2027 |
FY4 2028 |
FY5 2029 |
|---|---|---|---|---|---|---|---|---|---|---|
| Revenue | 4,428.4 | 4,720.7 | 3,136.3 | 4,006.4 | 3,616.5 | 3,535.6 | 3,456.5 | 3,379.1 | 3,303.5 | 3,229.6 |
| Revenue Growth, % | 0 | 6.6 | -33.56 | 27.74 | -9.73 | -2.24 | -2.24 | -2.24 | -2.24 | -2.24 |
| EBITDA | 948.8 | 949.1 | 566.1 | 812.0 | 723.1 | 706.0 | 690.2 | 674.8 | 659.7 | 644.9 |
| EBITDA, % | 21.43 | 20.1 | 18.05 | 20.27 | 19.99 | 19.97 | 19.97 | 19.97 | 19.97 | 19.97 |
| Depreciation | 338.1 | 341.3 | 356.2 | 374.8 | 364.4 | 322.8 | 315.6 | 308.5 | 301.6 | 294.9 |
| Depreciation, % | 7.63 | 7.23 | 11.36 | 9.35 | 10.08 | 9.13 | 9.13 | 9.13 | 9.13 | 9.13 |
| EBIT | 610.7 | 607.8 | 209.9 | 437.2 | 358.6 | 383.2 | 374.6 | 366.2 | 358.0 | 350.0 |
| EBIT, % | 13.79 | 12.88 | 6.69 | 10.91 | 9.92 | 10.84 | 10.84 | 10.84 | 10.84 | 10.84 |
| Total Cash | 490.8 | 1,189.1 | 1,049.7 | 1,208.4 | 1,334.7 | 967.4 | 945.7 | 924.6 | 903.9 | 883.6 |
| Total Cash, percent | .0 | .0 | .0 | .0 | .0 | .0 | .0 | .0 | .0 | .0 |
| Account Receivables | 2,607.2 | 2,101.3 | 1,788.9 | 1,973.5 | 1,934.2 | 1,860.9 | 1,819.2 | 1,778.5 | 1,738.7 | 1,699.8 |
| Account Receivables, % | 58.88 | 44.51 | 57.04 | 49.26 | 53.48 | 52.63 | 52.63 | 52.63 | 52.63 | 52.63 |
| Inventories | 1,349.0 | 1,530.8 | 1,361.2 | 1,509.6 | 1,464.5 | 1,304.4 | 1,275.2 | 1,246.7 | 1,218.8 | 1,191.5 |
| Inventories, % | 30.46 | 32.43 | 43.4 | 37.68 | 40.49 | 36.89 | 36.89 | 36.89 | 36.89 | 36.89 |
| Accounts Payable | 1,873.8 | 1,937.0 | 1,164.9 | 1,666.8 | 1,340.4 | 1,408.2 | 1,376.7 | 1,345.9 | 1,315.8 | 1,286.4 |
| Accounts Payable, % | 42.31 | 41.03 | 37.14 | 41.6 | 37.06 | 39.83 | 39.83 | 39.83 | 39.83 | 39.83 |
| Capital Expenditure | -261.2 | -629.5 | -380.2 | -271.8 | -121.6 | -293.5 | -286.9 | -280.5 | -274.2 | -268.1 |
| Capital Expenditure, % | -5.9 | -13.34 | -12.12 | -6.78 | -3.36 | -8.3 | -8.3 | -8.3 | -8.3 | -8.3 |
| Tax Rate, % | 7.05 | 7.05 | 7.05 | 7.05 | 7.05 | 7.05 | 7.05 | 7.05 | 7.05 | 7.05 |
| EBITAT | 538.3 | 542.4 | 203.0 | 407.5 | 333.4 | 352.7 | 344.8 | 337.1 | 329.6 | 322.2 |
| Depreciation | ||||||||||
| Changes in Account Receivables | ||||||||||
| Changes in Inventories | ||||||||||
| Changes in Accounts Payable | ||||||||||
| Capital Expenditure | ||||||||||
| UFCF | -1,467.2 | 641.5 | -111.1 | 679.5 | 334.3 | 683.3 | 412.9 | 403.6 | 394.6 | 385.8 |
| WACC, % | 5.01 | 5.01 | 5.03 | 5.02 | 5.02 | 5.02 | 5.02 | 5.02 | 5.02 | 5.02 |
| PV UFCF | ||||||||||
| SUM PV UFCF | 2,000.0 | |||||||||
| Long Term Growth Rate, % | 3.50 | |||||||||
| Free cash flow (T + 1) | 399 | |||||||||
| Terminal Value | 26,327 | |||||||||
| Present Terminal Value | 20,611 | |||||||||
| Enterprise Value | 22,611 | |||||||||
| Net Debt | -670 | |||||||||
| Equity Value | 23,281 | |||||||||
| Diluted Shares Outstanding, MM | 1,147 | |||||||||
| Equity Value Per Share | 20.31 |
Benefits You Will Receive
- Adjustable Forecast Parameters: Seamlessly modify key assumptions (growth %, margins, WACC) to generate various scenarios.
- Real-Time Data: Financial information for Tianrun Industry Technology Co., Ltd. (002283SZ) pre-loaded to enhance your analysis.
- Automated DCF Calculations: The template automatically computes Net Present Value (NPV) and intrinsic value for your convenience.
- Customizable and Professional Design: A sleek Excel model tailored to meet your valuation requirements.
- Designed for Analysts and Investors: Perfect for assessing projections, validating strategies, and optimizing your time.
Key Features
- Authentic Tianrun Financials: Gain access to reliable pre-loaded historical data and projected future performance.
- Adjustable Forecast Parameters: Modify highlighted cells for key variables like WACC, growth rates, and profit margins.
- Real-Time Calculations: Automatic recalculations for DCF, Net Present Value (NPV), and cash flow assessments.
- User-Friendly Dashboard: Intuitive charts and summaries designed to help you easily interpret your valuation outcomes.
- Designed for All Levels: An accessible layout tailored for investors, CFOs, and consultants alike.
How It Works
- Step 1: Download the ready-made Excel template that includes data for Tianrun Industry Technology Co., Ltd. (002283SZ).
- Step 2: Navigate through the pre-populated sheets to familiarize yourself with the essential metrics.
- Step 3: Modify the forecasts and assumptions in the editable yellow cells (WACC, growth, margins).
- Step 4: View the updated calculations immediately, including the intrinsic value of Tianrun Industry Technology Co., Ltd. (002283SZ).
- Step 5: Use the results to make well-informed investment decisions or create detailed reports.
Why Opt for Tianrun Industry Technology Co., Ltd. (002283SZ)?
- Efficiency Boost: Skip the hassle of developing financial models from the ground up – we're fully prepared for you.
- Enhanced Precision: Our trustworthy financial data and calculations minimize valuation errors.
- Completely Adjustable: Customize the model to align with your specific assumptions and forecasts.
- User-Friendly Insights: Intuitive charts and results make analysis straightforward.
- Endorsed by Professionals: Crafted for experts who prioritize accuracy and ease of use.
Who Can Benefit from This Product?
- Individual Investors: Make well-informed decisions regarding buying or selling shares of Tianrun Industry Technology Co., Ltd. (002283SZ).
- Financial Analysts: Optimize valuation processes with comprehensive, ready-made financial models tailored for Tianrun Industry Technology Co., Ltd. (002283SZ).
- Consultants: Provide clients with timely and precise valuation insights related to Tianrun Industry Technology Co., Ltd. (002283SZ).
- Business Owners: Gain an understanding of how major companies like Tianrun Industry Technology Co., Ltd. (002283SZ) are valued to inform your strategic decisions.
- Finance Students: Explore valuation techniques leveraging real-world data and situations specific to Tianrun Industry Technology Co., Ltd. (002283SZ).
Overview of Template Components
- Operating and Balance Sheet Data: Pre-filled historical data and forecasts for Tianrun Industry Technology Co., Ltd. (002283SZ), including metrics such as revenue, EBITDA, EBIT, and capital expenditures.
- WACC Calculation: A specialized sheet for calculating the Weighted Average Cost of Capital (WACC), featuring inputs such as Beta, risk-free rate, and share price.
- DCF Valuation (Unlevered and Levered): Customizable Discounted Cash Flow models that provide intrinsic value calculations with comprehensive breakdowns.
- Financial Statements: Pre-loaded annual and quarterly financial statements to facilitate in-depth analysis.
- Key Ratios: A comprehensive set of profitability, leverage, and efficiency ratios specific to Tianrun Industry Technology Co., Ltd. (002283SZ).
- Dashboard and Charts: A visual overview of valuation results and key assumptions to streamline data analysis.
Disclaimer
All information, articles, and product details provided on this website are for general informational and educational purposes only. We do not claim any ownership over, nor do we intend to infringe upon, any trademarks, copyrights, logos, brand names, or other intellectual property mentioned or depicted on this site. Such intellectual property remains the property of its respective owners, and any references here are made solely for identification or informational purposes, without implying any affiliation, endorsement, or partnership.
We make no representations or warranties, express or implied, regarding the accuracy, completeness, or suitability of any content or products presented. Nothing on this website should be construed as legal, tax, investment, financial, medical, or other professional advice. In addition, no part of this site—including articles or product references—constitutes a solicitation, recommendation, endorsement, advertisement, or offer to buy or sell any securities, franchises, or other financial instruments, particularly in jurisdictions where such activity would be unlawful.
All content is of a general nature and may not address the specific circumstances of any individual or entity. It is not a substitute for professional advice or services. Any actions you take based on the information provided here are strictly at your own risk. You accept full responsibility for any decisions or outcomes arising from your use of this website and agree to release us from any liability in connection with your use of, or reliance upon, the content or products found herein.