
|
Sichuan Development Lomon Co., Ltd. (002312.Sz) DCF -Bewertung |
Fully Editable: Tailor To Your Needs In Excel Or Sheets
Professional Design: Trusted, Industry-Standard Templates
Investor-Approved Valuation Models
MAC/PC Compatible, Fully Unlocked
No Expertise Is Needed; Easy To Follow
Sichuan Development Lomon Co., Ltd. (002312.SZ) Bundle
Unser (002312SZ) DCF-Taschenrechner entwickelt, ermöglicht es Ihnen, die Bewertung von Sichuan Development Lomon Co., Ltd., durch die Verwendung realer Finanzdaten zu bewerten und vollständige Flexibilität zu bieten, um alle wesentlichen Parameter für verbesserte Projektionen zu ändern.
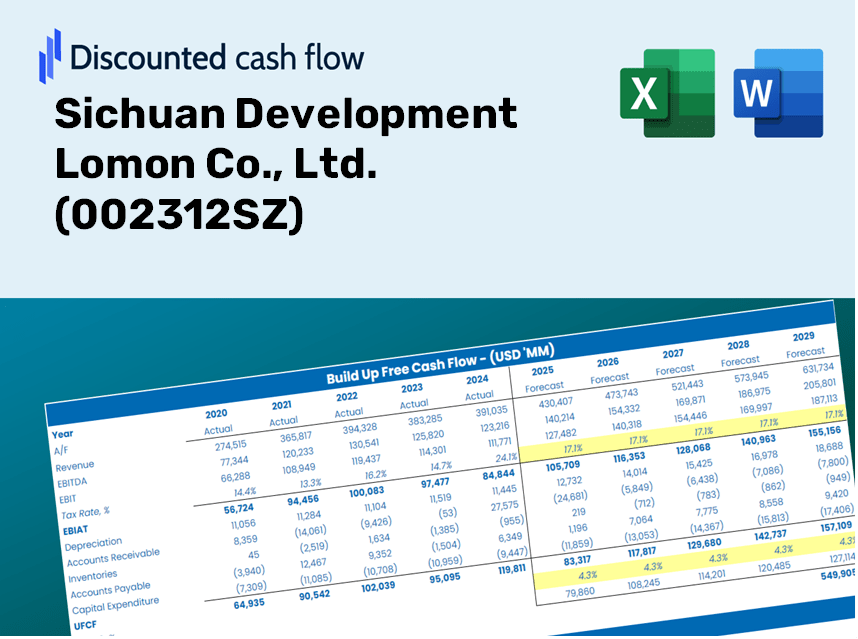
Discounted Cash Flow (DCF) - (USD MM)
| Year | AY1 2020 |
AY2 2021 |
AY3 2022 |
AY4 2023 |
AY5 2024 |
FY1 2025 |
FY2 2026 |
FY3 2027 |
FY4 2028 |
FY5 2029 |
|---|---|---|---|---|---|---|---|---|---|---|
| Revenue | 5,179.9 | 6,650.4 | 10,023.5 | 7,708.2 | 8,178.4 | 8,226.8 | 8,275.5 | 8,324.5 | 8,373.8 | 8,423.4 |
| Revenue Growth, % | 0 | 28.39 | 50.72 | -23.1 | 6.1 | 0.59199 | 0.59199 | 0.59199 | 0.59199 | 0.59199 |
| EBITDA | 771.8 | 1,188.7 | 1,773.0 | 846.2 | 1,057.3 | 1,223.6 | 1,230.8 | 1,238.1 | 1,245.5 | 1,252.8 |
| EBITDA, % | 14.9 | 17.87 | 17.69 | 10.98 | 12.93 | 14.87 | 14.87 | 14.87 | 14.87 | 14.87 |
| Depreciation | 254.4 | 335.9 | 443.1 | 467.8 | 486.0 | 434.3 | 436.8 | 439.4 | 442.0 | 444.6 |
| Depreciation, % | 4.91 | 5.05 | 4.42 | 6.07 | 5.94 | 5.28 | 5.28 | 5.28 | 5.28 | 5.28 |
| EBIT | 517.4 | 852.8 | 1,329.9 | 378.4 | 571.3 | 789.3 | 794.0 | 798.7 | 803.4 | 808.2 |
| EBIT, % | 9.99 | 12.82 | 13.27 | 4.91 | 6.99 | 9.59 | 9.59 | 9.59 | 9.59 | 9.59 |
| Total Cash | 449.4 | 1,007.9 | 2,257.3 | 3,568.2 | 3,192.2 | 2,166.5 | 2,179.4 | 2,192.3 | 2,205.2 | 2,218.3 |
| Total Cash, percent | .0 | .0 | .0 | .0 | .0 | .0 | .0 | .0 | .0 | .0 |
| Account Receivables | 1,356.8 | 351.8 | 482.9 | 328.3 | 335.7 | 734.9 | 739.3 | 743.6 | 748.0 | 752.5 |
| Account Receivables, % | 26.19 | 5.29 | 4.82 | 4.26 | 4.11 | 8.93 | 8.93 | 8.93 | 8.93 | 8.93 |
| Inventories | 520.6 | 1,129.4 | 1,196.6 | 1,150.0 | 1,175.3 | 1,123.1 | 1,129.8 | 1,136.5 | 1,143.2 | 1,150.0 |
| Inventories, % | 10.05 | 16.98 | 11.94 | 14.92 | 14.37 | 13.65 | 13.65 | 13.65 | 13.65 | 13.65 |
| Accounts Payable | 598.0 | 764.1 | 1,193.9 | 2,383.9 | 2,144.6 | 1,515.3 | 1,524.2 | 1,533.3 | 1,542.3 | 1,551.5 |
| Accounts Payable, % | 11.54 | 11.49 | 11.91 | 30.93 | 26.22 | 18.42 | 18.42 | 18.42 | 18.42 | 18.42 |
| Capital Expenditure | -163.0 | -417.0 | -614.0 | -825.7 | -969.8 | -627.1 | -630.8 | -634.5 | -638.3 | -642.1 |
| Capital Expenditure, % | -3.15 | -6.27 | -6.13 | -10.71 | -11.86 | -7.62 | -7.62 | -7.62 | -7.62 | -7.62 |
| Tax Rate, % | 15.58 | 15.58 | 15.58 | 15.58 | 15.58 | 15.58 | 15.58 | 15.58 | 15.58 | 15.58 |
| EBITAT | 446.6 | 666.7 | 1,063.9 | 342.2 | 482.3 | 662.0 | 665.9 | 669.9 | 673.9 | 677.8 |
| Depreciation | ||||||||||
| Changes in Account Receivables | ||||||||||
| Changes in Inventories | ||||||||||
| Changes in Accounts Payable | ||||||||||
| Capital Expenditure | ||||||||||
| UFCF | -741.4 | 1,147.9 | 1,124.4 | 1,375.5 | -273.7 | -507.1 | 469.9 | 472.7 | 475.5 | 478.3 |
| WACC, % | 4.29 | 4.24 | 4.25 | 4.31 | 4.28 | 4.27 | 4.27 | 4.27 | 4.27 | 4.27 |
| PV UFCF | ||||||||||
| SUM PV UFCF | 1,153.2 | |||||||||
| Long Term Growth Rate, % | 3.00 | |||||||||
| Free cash flow (T + 1) | 493 | |||||||||
| Terminal Value | 38,698 | |||||||||
| Present Terminal Value | 31,392 | |||||||||
| Enterprise Value | 32,545 | |||||||||
| Net Debt | 1,129 | |||||||||
| Equity Value | 31,417 | |||||||||
| Diluted Shares Outstanding, MM | 1,889 | |||||||||
| Equity Value Per Share | 16.63 |
What You Will Receive
- Authentic 002312SZ Financial Data: Pre-filled with Sichuan Development Lomon Co., Ltd.'s historical and forecasted data for accurate analysis.
- Fully Customizable Template: Effortlessly adjust key inputs such as revenue growth, WACC, and EBITDA percentage.
- Instant Calculations: Watch as the intrinsic value of Sichuan Development Lomon Co., Ltd. updates in real-time with your modifications.
- Expert Valuation Tool: Crafted for investors, analysts, and consultants who require precise DCF outcomes.
- Intuitive Design: Easy-to-follow layout and clear guidance suitable for users of all experience levels.
Key Features
- 🔍 Real-Life Sichuan Development Lomon Financials: Pre-filled historical and projected data for Sichuan Development Lomon Co., Ltd. (002312SZ).
- ✏️ Fully Customizable Inputs: Adjust all critical parameters (yellow cells) such as WACC, growth %, and tax rates.
- 📊 Professional DCF Valuation: Built-in formulas compute the intrinsic value of Sichuan Development Lomon using the Discounted Cash Flow method.
- ⚡ Instant Results: Visualize Sichuan Development Lomon’s valuation immediately after making adjustments.
- Scenario Analysis: Evaluate and compare outcomes for various financial assumptions side-by-side.
How It Operates
- Obtain the Template: Gain immediate access to the Excel-based DCF Calculator for Sichuan Development Lomon Co., Ltd. (002312SZ).
- Enter Your Assumptions: Modify the yellow-highlighted cells for growth rates, WACC, profit margins, and other variables.
- Real-Time Calculations: The model automatically recalculates the intrinsic value of Sichuan Development Lomon Co., Ltd. (002312SZ).
- Explore Scenarios: Test various assumptions to assess potential changes in valuation.
- Evaluate and Decide: Use the outcomes to inform your investment strategy or financial assessment.
Why Opt for This Calculator for Sichuan Development Lomon Co., Ltd. (002312SZ)?
- All-in-One Solution: Features DCF, WACC, and financial ratio analyses seamlessly combined.
- Flexible Inputs: Modify yellow-highlighted cells to explore different scenarios effortlessly.
- In-Depth Analysis: Automatically computes the intrinsic value and Net Present Value for Sichuan Development Lomon Co., Ltd.
- Ready-to-Use Data: Includes historical and projected data for reliable baseline assessments.
- Expert-Level Tool: Perfect for financial analysts, investors, and business advisors focusing on Sichuan Development Lomon Co., Ltd.
Who Can Benefit from This Product?
- Professional Investors: Develop comprehensive and accurate valuation models to evaluate investment opportunities related to Sichuan Development Lomon Co., Ltd. (002312SZ).
- Corporate Finance Teams: Assess valuation scenarios to direct strategic decision-making within the organization.
- Consultants and Advisors: Equip clients with precise valuation insights concerning Sichuan Development Lomon Co., Ltd. (002312SZ).
- Students and Educators: Utilize real-world data for hands-on experience in financial modeling and teaching.
- Industry Analysts: Gain a deeper understanding of how companies like Sichuan Development Lomon Co., Ltd. (002312SZ) are valued in the marketplace.
Contents of the Template
- Pre-Filled Data: Features Sichuan Development Lomon Co., Ltd.'s historical financials and projections.
- Discounted Cash Flow Model: An editable DCF valuation model with automatic calculations.
- Weighted Average Cost of Capital (WACC): A dedicated sheet for WACC calculation based on user-defined inputs.
- Key Financial Ratios: Assess the profitability, efficiency, and leverage of Sichuan Development Lomon Co., Ltd.
- Customizable Inputs: Modify revenue growth, profit margins, and tax rates effortlessly.
- Clear Dashboard: Visualizations and tables that summarize essential valuation outcomes.
Disclaimer
All information, articles, and product details provided on this website are for general informational and educational purposes only. We do not claim any ownership over, nor do we intend to infringe upon, any trademarks, copyrights, logos, brand names, or other intellectual property mentioned or depicted on this site. Such intellectual property remains the property of its respective owners, and any references here are made solely for identification or informational purposes, without implying any affiliation, endorsement, or partnership.
We make no representations or warranties, express or implied, regarding the accuracy, completeness, or suitability of any content or products presented. Nothing on this website should be construed as legal, tax, investment, financial, medical, or other professional advice. In addition, no part of this site—including articles or product references—constitutes a solicitation, recommendation, endorsement, advertisement, or offer to buy or sell any securities, franchises, or other financial instruments, particularly in jurisdictions where such activity would be unlawful.
All content is of a general nature and may not address the specific circumstances of any individual or entity. It is not a substitute for professional advice or services. Any actions you take based on the information provided here are strictly at your own risk. You accept full responsibility for any decisions or outcomes arising from your use of this website and agree to release us from any liability in connection with your use of, or reliance upon, the content or products found herein.