
|
Naura Technology Group Co., Ltd. (002371.sz) DCF -Bewertung |
Fully Editable: Tailor To Your Needs In Excel Or Sheets
Professional Design: Trusted, Industry-Standard Templates
Investor-Approved Valuation Models
MAC/PC Compatible, Fully Unlocked
No Expertise Is Needed; Easy To Follow
NAURA Technology Group Co., Ltd. (002371.SZ) Bundle
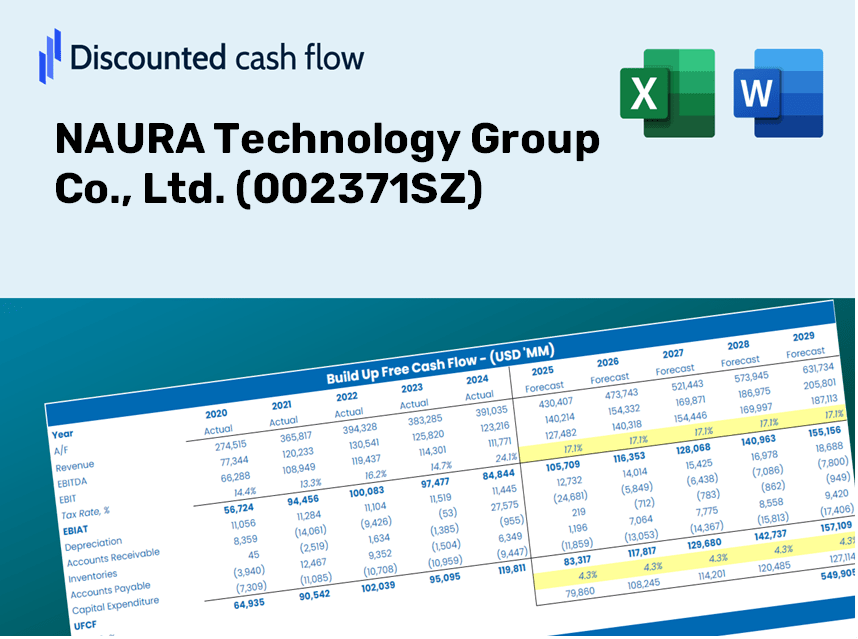
Meister Sie Ihre Naura Technology Group Co., Ltd. (002371SZ) Bewertungsanalyse mit unserem ausgefeilten DCF -Taschenrechner! Diese Excel -Vorlage wird mit realen (002371SZ) Daten vorinstalliert, sodass Sie Prognosen und Annahmen anpassen können, um den intrinsischen Wert der Naura Technology Group Co., Ltd. genau zu bestimmen.
Discounted Cash Flow (DCF) - (USD MM)
| Year | AY1 2020 |
AY2 2021 |
AY3 2022 |
AY4 2023 |
AY5 2024 |
FY1 2025 |
FY2 2026 |
FY3 2027 |
FY4 2028 |
FY5 2029 |
|---|---|---|---|---|---|---|---|---|---|---|
| Revenue | 6,056.0 | 9,683.5 | 14,688.1 | 22,079.5 | 29,838.1 | 44,536.4 | 66,475.2 | 99,221.1 | 148,097.8 | 221,051.3 |
| Revenue Growth, % | 0 | 59.9 | 51.68 | 50.32 | 35.14 | 49.26 | 49.26 | 49.26 | 49.26 | 49.26 |
| EBITDA | 585.9 | 1,366.7 | 2,980.6 | 4,681.2 | 7,408.7 | 8,026.6 | 11,980.5 | 17,882.2 | 26,691.0 | 39,839.0 |
| EBITDA, % | 9.68 | 14.11 | 20.29 | 21.2 | 24.83 | 18.02 | 18.02 | 18.02 | 18.02 | 18.02 |
| Depreciation | 353.4 | 431.0 | 500.4 | 597.0 | 926.2 | 1,737.0 | 2,592.7 | 3,869.9 | 5,776.2 | 8,621.6 |
| Depreciation, % | 5.84 | 4.45 | 3.41 | 2.7 | 3.1 | 3.9 | 3.9 | 3.9 | 3.9 | 3.9 |
| EBIT | 232.6 | 935.7 | 2,480.2 | 4,084.2 | 6,482.5 | 6,289.5 | 9,387.8 | 14,012.3 | 20,914.8 | 31,217.4 |
| EBIT, % | 3.84 | 9.66 | 16.89 | 18.5 | 21.73 | 14.12 | 14.12 | 14.12 | 14.12 | 14.12 |
| Total Cash | 2,642.4 | 9,067.6 | 10,434.6 | 12,451.5 | 12,347.2 | 27,264.1 | 40,694.5 | 60,740.8 | 90,661.9 | 135,322.3 |
| Total Cash, percent | .0 | .0 | .0 | .0 | .0 | .0 | .0 | .0 | .0 | .0 |
| Account Receivables | 2,641.0 | 3,824.4 | .0 | 6,064.5 | 7,940.7 | 12,219.3 | 18,238.6 | 27,223.0 | 40,633.1 | 60,649.2 |
| Account Receivables, % | 43.61 | 39.49 | 0 | 27.47 | 26.61 | 27.44 | 27.44 | 27.44 | 27.44 | 27.44 |
| Inventories | 4,933.2 | 8,034.6 | 13,040.6 | 16,992.0 | 23,478.6 | 36,418.4 | 54,358.2 | 81,135.3 | 121,102.8 | 180,758.5 |
| Inventories, % | 81.46 | 82.97 | 88.78 | 76.96 | 78.69 | 81.77 | 81.77 | 81.77 | 81.77 | 81.77 |
| Accounts Payable | 2,671.9 | 3,120.3 | 4,269.6 | 7,858.0 | 12,190.0 | 16,198.2 | 24,177.5 | 36,087.4 | 53,864.2 | 80,397.9 |
| Accounts Payable, % | 44.12 | 32.22 | 29.07 | 35.59 | 40.85 | 36.37 | 36.37 | 36.37 | 36.37 | 36.37 |
| Capital Expenditure | -668.3 | -446.8 | -1,408.6 | -1,980.0 | -2,046.2 | -3,657.8 | -5,459.6 | -8,149.1 | -12,163.3 | -18,155.0 |
| Capital Expenditure, % | -11.04 | -4.61 | -9.59 | -8.97 | -6.86 | -8.21 | -8.21 | -8.21 | -8.21 | -8.21 |
| Tax Rate, % | 13.66 | 13.66 | 13.66 | 13.66 | 13.66 | 13.66 | 13.66 | 13.66 | 13.66 | 13.66 |
| EBITAT | 182.5 | 804.8 | 2,044.2 | 3,566.1 | 5,596.9 | 5,290.4 | 7,896.4 | 11,786.3 | 17,592.2 | 26,258.2 |
| Depreciation | ||||||||||
| Changes in Account Receivables | ||||||||||
| Changes in Inventories | ||||||||||
| Changes in Accounts Payable | ||||||||||
| Capital Expenditure | ||||||||||
| UFCF | -5,034.8 | -3,047.4 | 1,103.8 | -4,244.4 | 446.1 | -9,840.5 | -10,950.3 | -16,344.4 | -24,395.8 | -36,413.2 |
| WACC, % | 4.52 | 4.52 | 4.52 | 4.52 | 4.52 | 4.52 | 4.52 | 4.52 | 4.52 | 4.52 |
| PV UFCF | ||||||||||
| SUM PV UFCF | -83,381.6 | |||||||||
| Long Term Growth Rate, % | 4.00 | |||||||||
| Free cash flow (T + 1) | -37,870 | |||||||||
| Terminal Value | -7,258,096 | |||||||||
| Present Terminal Value | -5,818,207 | |||||||||
| Enterprise Value | -5,901,588 | |||||||||
| Net Debt | -8,236 | |||||||||
| Equity Value | -5,893,353 | |||||||||
| Diluted Shares Outstanding, MM | 718 | |||||||||
| Equity Value Per Share | -8,204.45 |
What You Will Receive
- Customizable Excel Template: A tailored Excel-based DCF Calculator featuring pre-filled historical financials for NAURA Technology Group Co., Ltd. (002371SZ).
- Comprehensive Data: Access to historical performance metrics and forward-looking projections (highlighted in the yellow cells).
- Flexible Forecasts: Adjust key assumptions such as revenue growth, EBITDA percentage, and WACC to fit your analysis.
- Instant Calculations: Observe real-time effects of your inputs on NAURA's valuation.
- Professional Resource: Designed for use by investors, CFOs, consultants, and financial analysts.
- User-Centric Design: Organized for straightforward navigation and ease of use, complete with step-by-step guidance.
Key Features
- Comprehensive DCF Calculator: Offers detailed unlevered and levered DCF valuation frameworks tailored for NAURA Technology Group Co., Ltd. (002371SZ).
- WACC Tool: Features a pre-constructed Weighted Average Cost of Capital template with adjustable parameters.
- Customizable Forecast Inputs: Adjust growth rates, capital expenditures, and discount rates as needed.
- Integrated Financial Ratios: Evaluate profitability, leverage, and efficiency ratios specifically for NAURA Technology Group Co., Ltd. (002371SZ).
- Interactive Dashboard and Visualizations: Graphical outputs provide a clear summary of essential valuation metrics for straightforward analysis.
How It Works
- Download: Obtain the pre-built Excel file containing NAURA Technology Group Co., Ltd.'s financial data.
- Customize: Modify forecasts, such as revenue growth, EBITDA %, and WACC.
- Update Automatically: The intrinsic value and NPV calculations refresh in real-time.
- Test Scenarios: Generate various projections and instantly compare results.
- Make Decisions: Utilize the valuation outcomes to inform your investment strategy with NAURA Technology Group Co., Ltd. (002371SZ).
Why Choose NAURA Technology Group's Calculator?
- Precision: Utilizes accurate financial data specific to NAURA Technology Group (002371SZ).
- Versatility: Equipped for users to easily test and adjust inputs as needed.
- Efficiency: Eliminate the complexity of constructing a DCF model from the ground up.
- Enterprise-Level: Crafted with the expertise and attention to detail expected from top financial executives.
- User-Friendly: Intuitive design allows users of all skill levels to navigate with ease.
Who Should Use This Product?
- Investors: Accurately assess the fair value of NAURA Technology Group Co., Ltd. (002371SZ) before making investment choices.
- CFOs: Utilize a professional-grade DCF model for financial reporting and analysis specific to NAURA Technology Group.
- Consultants: Effortlessly customize the template for valuation reports tailored to NAURA Technology Group's clients.
- Entrepreneurs: Acquire insights into financial modeling techniques utilized by Fortune 500 companies relevant to NAURA Technology Group.
- Educators: Employ this tool as a resource to teach various valuation methodologies applicable to NAURA Technology Group.
Contents of the Template
- Historical Data: Features NAURA Technology’s previous financial performance and baseline forecasts.
- DCF and Levered DCF Models: Comprehensive templates for assessing NAURA Technology’s intrinsic value.
- WACC Sheet: Ready-made calculations for the Weighted Average Cost of Capital.
- Editable Inputs: Adjust key parameters such as growth rates, EBITDA percentages, and CAPEX assumptions.
- Quarterly and Annual Statements: An exhaustive overview of NAURA Technology’s financial reports.
- Interactive Dashboard: Dynamically visualize valuation outcomes and forecasts.
Disclaimer
All information, articles, and product details provided on this website are for general informational and educational purposes only. We do not claim any ownership over, nor do we intend to infringe upon, any trademarks, copyrights, logos, brand names, or other intellectual property mentioned or depicted on this site. Such intellectual property remains the property of its respective owners, and any references here are made solely for identification or informational purposes, without implying any affiliation, endorsement, or partnership.
We make no representations or warranties, express or implied, regarding the accuracy, completeness, or suitability of any content or products presented. Nothing on this website should be construed as legal, tax, investment, financial, medical, or other professional advice. In addition, no part of this site—including articles or product references—constitutes a solicitation, recommendation, endorsement, advertisement, or offer to buy or sell any securities, franchises, or other financial instruments, particularly in jurisdictions where such activity would be unlawful.
All content is of a general nature and may not address the specific circumstances of any individual or entity. It is not a substitute for professional advice or services. Any actions you take based on the information provided here are strictly at your own risk. You accept full responsibility for any decisions or outcomes arising from your use of this website and agree to release us from any liability in connection with your use of, or reliance upon, the content or products found herein.