
|
Peking Dabeinong Technology Group Co., Ltd. (002385.sz) DCF -Bewertung |
Fully Editable: Tailor To Your Needs In Excel Or Sheets
Professional Design: Trusted, Industry-Standard Templates
Investor-Approved Valuation Models
MAC/PC Compatible, Fully Unlocked
No Expertise Is Needed; Easy To Follow
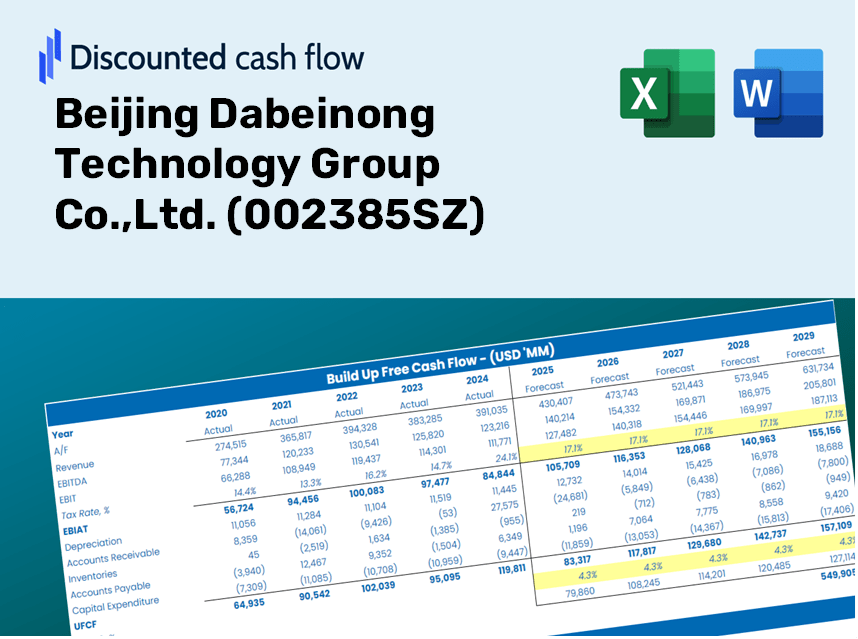
Beijing Dabeinong Technology Group Co.,Ltd. (002385.SZ) Bundle
Vereinfachen Sie die Bewertung von Peking Dabeinong Technology Group Co., Ltd. (002385SZ) mit diesem anpassbaren DCF -Taschenrechner! Mit der Real Peking Dabeinong Technology Group Co., Ltd. (002385SZ) Finanzdaten und einstellbaren Prognoseeingaben können Sie Szenarien testen und den beizulegenden Zeitwert von Peking Dabeinong Technology Group Co.
What You Will Receive
- Pre-Configured Financial Model: Leverage Beijing Dabeinong's actual data for accurate DCF valuations.
- Comprehensive Forecast Control: Modify revenue growth, profit margins, WACC, and other essential factors.
- Real-Time Calculations: Instant updates allow you to view results as you implement changes.
- Professional-Grade Template: A polished Excel file crafted for top-tier valuation purposes.
- Adaptable and Reusable: Designed for versatility, facilitating repeated usage for in-depth forecasts.
Key Features
- Comprehensive Valuation Model: Features detailed unlevered and levered DCF models tailored for Beijing Dabeinong Technology Group Co., Ltd. (002385SZ).
- WACC Tool: User-friendly Weighted Average Cost of Capital calculator with adjustable input options.
- Customizable Forecast Inputs: Adjust growth projections, capital expenditures, and discount rates as needed.
- Integrated Financial Metrics: Evaluate key profitability, leverage, and efficiency ratios for Beijing Dabeinong Technology Group Co., Ltd. (002385SZ).
- Interactive Dashboard and Graphs: Visual representations provide a clear overview of essential valuation metrics for straightforward analysis.
How It Works
- 1. Access the Template: Download and open the Excel file containing Beijing Dabeinong Technology Group Co., Ltd.’s preloaded data.
- 2. Adjust Assumptions: Modify key inputs such as growth rates, WACC, and capital expenditures to fit your analysis.
- 3. See Results Immediately: The DCF model automatically calculates intrinsic value and NPV based on your inputs.
- 4. Explore Scenarios: Evaluate various forecasts to examine different valuation possibilities.
- 5. Present with Assurance: Deliver professional valuation insights that bolster your decision-making process.
Why Opt for This Calculator?
- Precise Information: Accurate financial data for Beijing Dabeinong Technology Group Co., Ltd. ([002385SZ]) guarantees trustworthy valuation outcomes.
- Personalizable: Tailor essential factors such as growth projections, WACC, and tax rates to align with your forecasts.
- Efficient: Built-in calculations save you the hassle of starting from the ground up.
- Expert-Level Tool: Crafted for investors, analysts, and consultants in mind.
- Easy to Use: A straightforward design with clear, step-by-step guidance for all levels of users.
Who Should Utilize Our Solutions?
- Investors: Make informed choices with our advanced valuation tools tailored for market insights on Beijing Dabeinong Technology Group Co.,Ltd. (002385SZ).
- Financial Analysts: Increase efficiency with our customizable DCF models designed for in-depth analysis of (002385SZ).
- Consultants: Seamlessly adapt our templates for impactful client presentations and comprehensive reports focused on (002385SZ).
- Finance Enthusiasts: Enhance your grasp of valuation methodologies using practical examples from Beijing Dabeinong Technology Group Co.,Ltd. (002385SZ).
- Educators and Students: Employ our tools as a hands-on resource in finance courses, focusing on the intricacies of (002385SZ).
Contents of the Template
- Comprehensive DCF Model: An editable template featuring in-depth valuation computations.
- Real-World Data: Preloaded historical and projected financials for Beijing Dabeinong Technology Group Co., Ltd. (002385SZ) to facilitate analysis.
- Customizable Parameters: Modify WACC, growth rates, and tax assumptions to explore different scenarios.
- Financial Statements: Detailed annual and quarterly breakdowns for enhanced insights.
- Key Ratios: Integrated analysis of profitability, efficiency, and leverage metrics.
- Dashboard with Visual Outputs: Charts and tables designed for clear and actionable insights.
Disclaimer
All information, articles, and product details provided on this website are for general informational and educational purposes only. We do not claim any ownership over, nor do we intend to infringe upon, any trademarks, copyrights, logos, brand names, or other intellectual property mentioned or depicted on this site. Such intellectual property remains the property of its respective owners, and any references here are made solely for identification or informational purposes, without implying any affiliation, endorsement, or partnership.
We make no representations or warranties, express or implied, regarding the accuracy, completeness, or suitability of any content or products presented. Nothing on this website should be construed as legal, tax, investment, financial, medical, or other professional advice. In addition, no part of this site—including articles or product references—constitutes a solicitation, recommendation, endorsement, advertisement, or offer to buy or sell any securities, franchises, or other financial instruments, particularly in jurisdictions where such activity would be unlawful.
All content is of a general nature and may not address the specific circumstances of any individual or entity. It is not a substitute for professional advice or services. Any actions you take based on the information provided here are strictly at your own risk. You accept full responsibility for any decisions or outcomes arising from your use of this website and agree to release us from any liability in connection with your use of, or reliance upon, the content or products found herein.